

Morgan Stanley stock holds narrow recent range amid oversold chart signals: weekly analysis

Shares of Morgan Stanley (MS) are trading near $196 after a fall of just over 3% this week, with the chart showing a clear buildup of oversold signals as downside pressure continues. Momentum has shifted negative as technical readings point to stretched selling, but no bullish reversal is confirmed yet. Uncertainty around support and resistance will shape sentiment in the days ahead.
 186.08
192.90
Highlights
- Shares of Morgan Stanley fell 3.11% over the past 7 days, now trading at $196.22 below near-term moving averages.
- Bearish momentum dominates, with negative signals from MACD and CCI, while oversold conditions suggest stretched selling without reversal signals.
- For the coming week, price range is expected between $192.28 and $200.84, with a 73% probability of a further decline.
AI IPO exposure and leaked client list elevate uncertainty this week
Morgan Stanley shares came under pressure in recent days as the bank was named a lead underwriter for upcoming AI-focused IPOs Nscale and Accelevation, according to Reuters, Investing.com, financial-news.co.uk, and gurufocus.com. A separate confidential investment banking client list was also inadvertently leaked to some clients, as reported by The Business Times on September 24, 2026. Sector-wide weakness and the firm's prominent dealmaking activity remain relevant for the outlook this week.
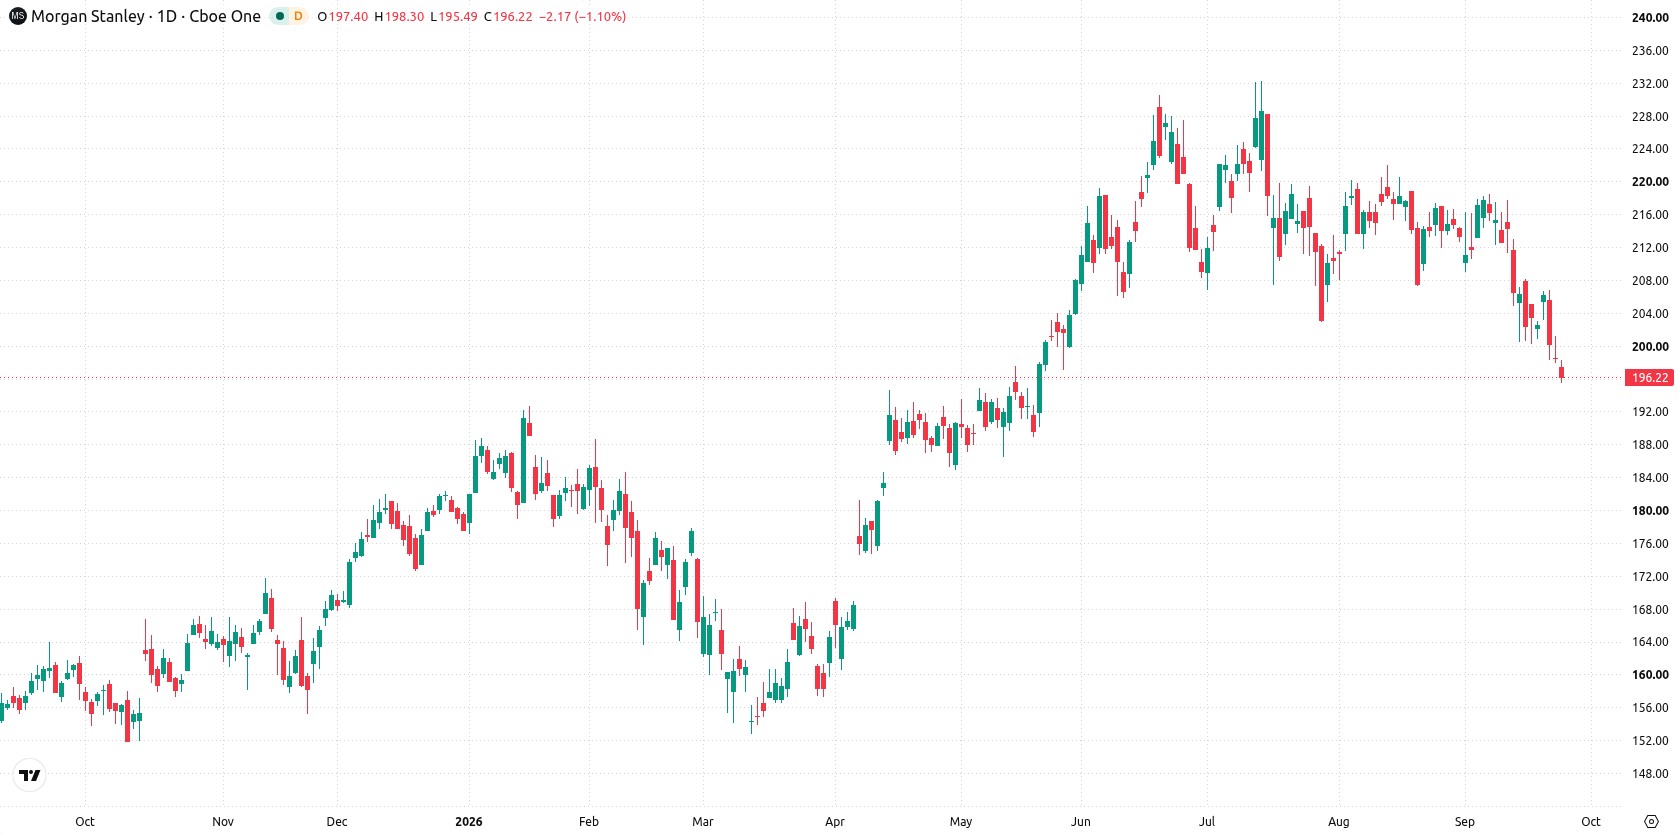
Oversold indicators persist as volatility stays high during the week
The daily chart signals pressure as momentum turns negative, highlighted by a MACD reading of -5.01 and a CCI value of -135.69 in the oversold zone. Volatility remains elevated at 4.45%, with price action displaying a contained move within a narrow range. RSI is approaching oversold territory, which, alongside existing oversold signals, suggests selling may be stretched, though there are as yet no reversal signals. Immediate levels to watch are support at $193.39 and resistance at $197.94, with the Kijun line at $208.36 capping rallies for now.
Further consolidation likely as bearish probabilities outweigh upside cues
For the coming trading week, the expected range is $192.28 to $200.84, with a 27% probability of an increase and a 73% probability of a decrease. Base case favors further consolidation between $193.39 and $197.94. A daily close above resistance at $197.94 could trigger a move toward $200.84, while any drop below support at $193.39 opens the way toward $192.28.
Earlier, analysts noted that Morgan Stanley remained under downward pressure despite its ongoing involvement in high-profile capital markets activity. The current analysis strengthens this view with fresh technical evidence of persistent negative momentum and highlights that any sustained move below $193.39 could signal renewed downside risk in the near term.










-
 Afghanistan
-
 Albania
-
 Algeria
-
 Angola
-
 Argentina
-
 Armenia
-
 Australia
-
 Austria
-
 Azerbaijan
-
 Bahamas
-
 Bahrain
-
 Bangladesh
-
 Belarus
-
 Belgium
-
 Bolivia
-
 Botswana
-
 Brazil
-
 Brunei
-
 Bulgaria
-
 Cambodia
-
 Cameroon
-
 Canada
-
 Chile
-
 China
-
 Colombia
-
 Congo
-
 Costa Rica
-
 Cote d'Ivoire
-
 Croatia
-
 Cuba
-
 Cyprus
-
 Czechia
-
 DR Congo
-
 Denmark
-
 Dominican Republic
-
 Ecuador
-
 Egypt
-
 El Salvador
-
 Estonia
-
 Eswatini
-
 Ethiopia
-
 Finland
-
 France
-
 Georgia
-
 Germany
-
 Ghana
-
 Greece
-
 Haiti
-
 Hong Kong
-
 Hungary
-
 India
-
 Indonesia
-
 Iran, Islamic republic
-
 Iraq
-
 Ireland
-
 Israel
-
 Italy
-
 Jamaica
-
 Japan
-
 Jordan
-
 Kazakhstan
-
 Kenya
-
 Korea
-
 Kuwait
-
 Kyrgyzstan
-
 Laos
-
 Latvia
-
 Lebanon
-
 Lesotho
-
 Libya
-
 Lithuania
-
 Luxembourg
-
 Madagascar
-
 Malaysia
-
 Malta
-
 Mauritius
-
 Mexico
-
 Moldova
-
 Mongolia
-
 Montenegro
-
 Morocco
-
 Mozambique
-
 Myanmar
-
 Namibia
-
 Nepal
-
 Netherlands
-
 New Zealand
-
 Nigeria
-
 North Macedonia
-
 Norway
-
 Oman
-
 Pakistan
-
 Palestine
-
 Panama
-
 Papua New Guinea
-
 Paraguay
-
 Peru
-
 Philippines
-
 Poland
-
 Portugal
-
 Puerto Rico
-
 Qatar
-
 Reunion
-
 Romania
-
 Rwanda
-
 Saudi Arabia
-
 Serbia
-
 Singapore
-
 Slovakia
-
 Slovenia
-
 Somalia
-
 South Africa
-
 Spain
-
 Sri Lanka
-
 Sweden
-
 Switzerland
-
 Syria
-
 Taiwan
-
 Tajikistan
-
 Tanzania
-
 Thailand
-
 Trinidad and Tobago
-
 Tunisia
-
 Turkey
-
 UAE
-
 Uganda
-
 Ukraine
-
 United Kingdom
-
United States
-
 Uruguay
-
 Uzbekistan
-
 Venezuela
-
 Vietnam
-
 Yemen
-
 Zambia
-
 Zimbabwe
- Forex
- Crypto












