

ServiceNow stock weekly forecast: Upside capped near resistance at $142.1 with flat price trend in focus

Shares of ServiceNow, Inc. (NOW) are trading near $139 after gaining around 3% over the past week, as the stock extends its recovery but encounters some overbought risk. Positive corporate momentum and robust demand have underpinned the advance, with the outlook now hinging on whether support levels can continue to hold into next week.
 109.90
158.90
Highlights
- Shares of ServiceNow rose 3.01% over the past week to $139.08, maintaining a bullish structure.
- The stock is consolidating above key support at $138.26, facing resistance at $142.1 within a narrow range.
- Strong buy signals from technical indicators and a forecasted range of $135.95 to $155.28 indicate a high probability of further upside.
AI partnerships and guidance boosts shape sentiment and corporate interest this week
ServiceNow has attracted attention following INRY's implementation of its EmployeeWorks solution in March 2026, which reportedly reduced median submission times for self-service requests by 60% and achieved a 97% completion rate, according to Simply Wall St. Yahoo Finance and Investing.com also highlighted expanded AI partnerships and increased management guidance for 2026 subscription revenue midpoint, further supporting sentiment. The appointment of former ServiceNow CFO Mike Scarpelli to ClickHouse's board is a minor development for NOW itself.
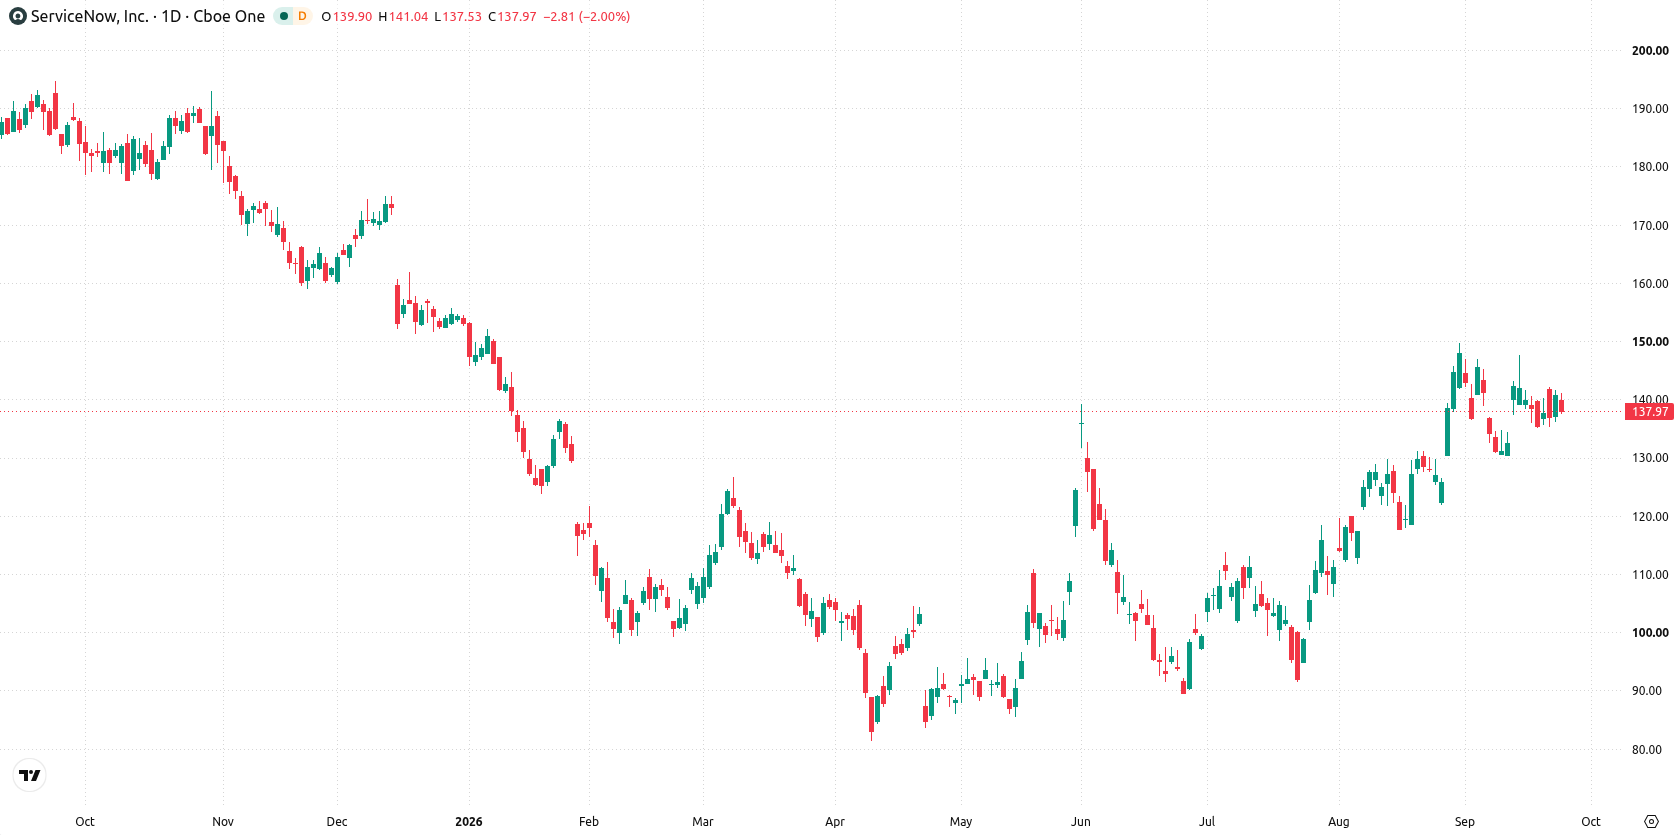
Flat trend dominates as MACD signals upside but range tightens over the week
On the daily chart, ServiceNow is exhibiting a flat trend, with price action firmly holding above most key moving averages and anchored by the MA-20 nearby. MACD signals further upside with a strong buy indication at 3.91, confirmed by the HMA at $137.32, while volatility over the past week stands at 5.17%. The overall momentum character points to a contained move within a narrow range, while oscillators such as RSI (57.54) remain in the neutral zone. Support emerges at $138.26, with resistance at $142.1, while the Ichimoku Kijun at $133.66 provides an additional support marker.
Upside bias favored next week as breakout risk centers on resistance levels
Next week, the expected trading range is $135.95 to $155.28, with a very high probability of an increase and a very low probability of a decrease. The base case sees continued consolidation between support at $138.26 and resistance at $142.1. A break above $142.1 would open a higher move toward the top end of the range, while a dip below $138.26 may trigger a test of lower supports, initially near $135.95.
Earlier, analysts noted that ServiceNow exhibited bullish technical momentum and robust fundamentals, with potential for further gains as the stock held above key moving averages. The current setup affirms these positive signals, but with the trend appearing more range-bound, traders should monitor the $142.1 resistance as a potential trigger for renewed upside out of consolidation.






Latest ServiceNow News



-
 Afghanistan
-
 Albania
-
 Algeria
-
 Angola
-
 Argentina
-
 Armenia
-
 Australia
-
 Austria
-
 Azerbaijan
-
 Bahamas
-
 Bahrain
-
 Bangladesh
-
 Belarus
-
 Belgium
-
 Bolivia
-
 Botswana
-
 Brazil
-
 Brunei
-
 Bulgaria
-
 Cambodia
-
 Cameroon
-
 Canada
-
 Chile
-
 China
-
 Colombia
-
 Congo
-
 Costa Rica
-
 Cote d'Ivoire
-
 Croatia
-
 Cuba
-
 Cyprus
-
 Czechia
-
 DR Congo
-
 Denmark
-
 Dominican Republic
-
 Ecuador
-
 Egypt
-
 El Salvador
-
 Estonia
-
 Eswatini
-
 Ethiopia
-
 Finland
-
 France
-
 Georgia
-
 Germany
-
 Ghana
-
 Greece
-
 Haiti
-
 Hong Kong
-
 Hungary
-
 India
-
 Indonesia
-
 Iran, Islamic republic
-
 Iraq
-
 Ireland
-
 Israel
-
 Italy
-
 Jamaica
-
 Japan
-
 Jordan
-
 Kazakhstan
-
 Kenya
-
 Korea
-
 Kuwait
-
 Kyrgyzstan
-
 Laos
-
 Latvia
-
 Lebanon
-
 Lesotho
-
 Libya
-
 Lithuania
-
 Luxembourg
-
 Madagascar
-
 Malaysia
-
 Malta
-
 Mauritius
-
 Mexico
-
 Moldova
-
 Mongolia
-
 Montenegro
-
 Morocco
-
 Mozambique
-
 Myanmar
-
 Namibia
-
 Nepal
-
 Netherlands
-
 New Zealand
-
 Nigeria
-
 North Macedonia
-
 Norway
-
 Oman
-
 Pakistan
-
 Palestine
-
 Panama
-
 Papua New Guinea
-
 Paraguay
-
 Peru
-
 Philippines
-
 Poland
-
 Portugal
-
 Puerto Rico
-
 Qatar
-
 Reunion
-
 Romania
-
 Rwanda
-
 Saudi Arabia
-
 Serbia
-
 Singapore
-
 Slovakia
-
 Slovenia
-
 Somalia
-
 South Africa
-
 Spain
-
 Sri Lanka
-
 Sweden
-
 Switzerland
-
 Syria
-
 Taiwan
-
 Tajikistan
-
 Tanzania
-
 Thailand
-
 Trinidad and Tobago
-
 Tunisia
-
 Turkey
-
 UAE
-
 Uganda
-
 Ukraine
-
 United Kingdom
-
United States
-
 Uruguay
-
 Uzbekistan
-
 Venezuela
-
 Vietnam
-
 Yemen
-
 Zambia
-
 Zimbabwe
- Forex
- Crypto












