

Can Agnico Eagle Mines stock hold support as oversold conditions limit further selling?

Agnico Eagle Mines (AEM) stock is trading at C$272.14, posting a daily loss of 1.22%. The shares are currently sitting below their key short- and medium-term moving averages, suggesting downward pressure in the near term.
 270.75
Highlights
- Agnico Eagle Mines returned a record $625 million to shareholders in Q2 2026 through dividends and share buybacks, totaling $1 billion in the first half.
- The company increased its quarterly dividend by 12.5% to $0.45 per share, allocating 48% of first-half free cash flow to shareholder distributions.
- Shares of Agnico Eagle Mines trade below key moving averages with sellers dominating, and the price is expected to range between C$265.47 and C$278.81 with further downside favored.
Record capital returns as cash flow drives enhanced shareholder payouts
Agnico Eagle Mines returned a record $625 million to shareholders through dividends and share repurchases in the second quarter of 2026, amounting to 48% of its first-half free cash flow, according to Tradingview. This substantial payout was part of a broader distribution of $1 billion to shareholders in the first half of the year, highlighting the company’s strong cash generation and commitment to capital returns. Additionally, Agnico Eagle Mines raised its quarterly dividend by 12.5% to 45 cents per share, signaling a focus on shareholder value, though price action has remained under broader selling pressure.
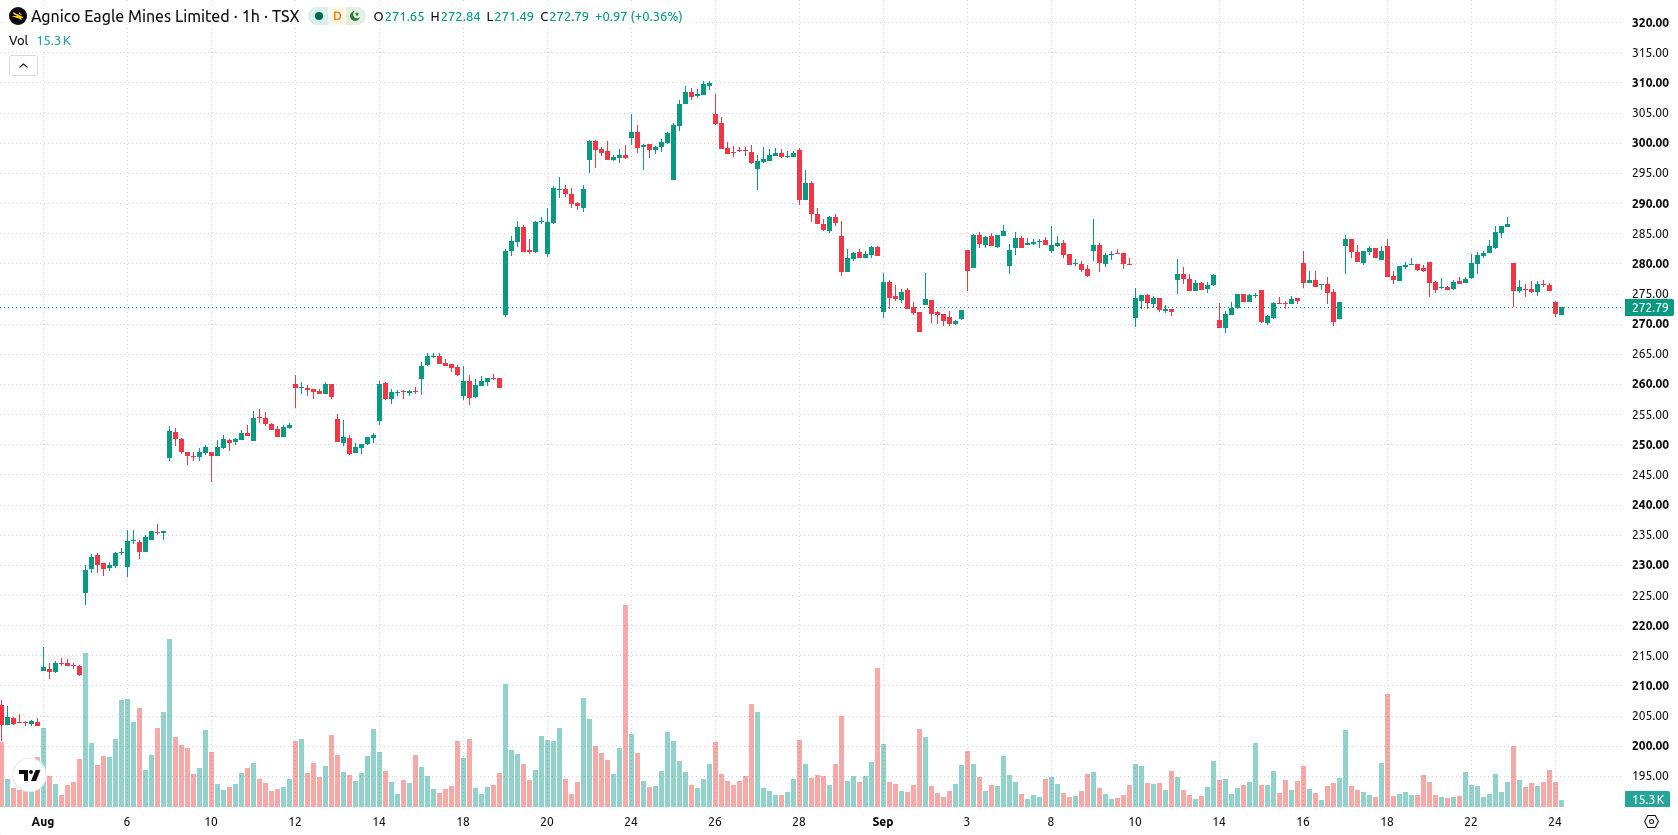
Momentum stays bearish as mixed signals and oversold readings emerge
On the technical front, AEM is trading below both the MA-20 (C$278.71) and MA-50 (C$277.78) on the H1 chart, while remaining above the MA-200 (C$260.79), which provides long-term support. The Ichimoku Kijun level at C$280.3 marks the next immediate resistance point. Among momentum indicators, MACD and ADX are neutral, whereas RSI stands at 42.4, CCI flashes a Sell signal, Stochastic RSI and Bull/Bear Power are both in oversold territory, and Awesome Oscillator is neutral. This mix reflects seller dominance with persistent downward momentum, despite some oscillators highlighting potentially oversold conditions.
Further downside risk as volatility bands guide short-term direction
In the short term, AEM is likely to trade between support at C$265.47 and resistance at C$278.81. The probability distribution moderately favors further downside, with a 76% chance of declining and a 24% chance of a rebound. The baseline scenario anticipates price action contained within this volatility band. However, a move above C$280.3 could trigger a rally, while a sustained drop below C$265.47 may lead to renewed selling momentum.
Earlier, analysts noted that downside risk was reinforced for Agnico Eagle Mines following an earnings estimate downgrade and increased volatility. The current analysis adds that, despite robust capital returns, the stock remains under technical pressure with key support now at C$265.47—making sustained price action below this level a crucial downside risk to monitor.










-
 Afghanistan
-
 Albania
-
 Algeria
-
 Angola
-
 Argentina
-
 Armenia
-
 Australia
-
 Austria
-
 Azerbaijan
-
 Bahamas
-
 Bahrain
-
 Bangladesh
-
 Belarus
-
 Belgium
-
 Bolivia
-
 Botswana
-
 Brazil
-
 Brunei
-
 Bulgaria
-
 Cambodia
-
 Cameroon
-
 Canada
-
 Chile
-
 China
-
 Colombia
-
 Congo
-
 Costa Rica
-
 Cote d'Ivoire
-
 Croatia
-
 Cuba
-
 Cyprus
-
 Czechia
-
 DR Congo
-
 Denmark
-
 Dominican Republic
-
 Ecuador
-
 Egypt
-
 El Salvador
-
 Estonia
-
 Eswatini
-
 Ethiopia
-
 Finland
-
 France
-
 Georgia
-
 Germany
-
 Ghana
-
 Greece
-
 Haiti
-
 Hong Kong
-
 Hungary
-
 India
-
 Indonesia
-
 Iran, Islamic republic
-
 Iraq
-
 Ireland
-
 Israel
-
 Italy
-
 Jamaica
-
 Japan
-
 Jordan
-
 Kazakhstan
-
 Kenya
-
 Korea
-
 Kuwait
-
 Kyrgyzstan
-
 Laos
-
 Latvia
-
 Lebanon
-
 Lesotho
-
 Libya
-
 Lithuania
-
 Luxembourg
-
 Madagascar
-
 Malaysia
-
 Malta
-
 Mauritius
-
 Mexico
-
 Moldova
-
 Mongolia
-
 Montenegro
-
 Morocco
-
 Mozambique
-
 Myanmar
-
 Namibia
-
 Nepal
-
 Netherlands
-
 New Zealand
-
 Nigeria
-
 North Macedonia
-
 Norway
-
 Oman
-
 Pakistan
-
 Palestine
-
 Panama
-
 Papua New Guinea
-
 Paraguay
-
 Peru
-
 Philippines
-
 Poland
-
 Portugal
-
 Puerto Rico
-
 Qatar
-
 Reunion
-
 Romania
-
 Rwanda
-
 Saudi Arabia
-
 Serbia
-
 Singapore
-
 Slovakia
-
 Slovenia
-
 Somalia
-
 South Africa
-
 Spain
-
 Sri Lanka
-
 Sweden
-
 Switzerland
-
 Syria
-
 Taiwan
-
 Tajikistan
-
 Tanzania
-
 Thailand
-
 Trinidad and Tobago
-
 Tunisia
-
 Turkey
-
 UAE
-
 Uganda
-
 Ukraine
-
 United Kingdom
-
United States
-
 Uruguay
-
 Uzbekistan
-
 Venezuela
-
 Vietnam
-
 Yemen
-
 Zambia
-
 Zimbabwe
- Forex
- Crypto












