

CRM shares face resistance at $242.63 with direction hinging on upcoming tests: weekly analysis

Shares of Salesforce, Inc. (CRM) are trading near $240 as the stock stretches into oversold territory. The daily signals are mixed, with momentum constrained by conflicting indicators, keeping the outlook cautious as traders look for stronger evidence of direction in the days ahead.
 244.64
249.00
Highlights
- Shares of Salesforce rose to $239.75 over the past week, trading below the 20-day moving average but above longer-term averages, maintaining a bullish structure.
- Technical indicator signals are mixed, with MACD showing a buy, Stochastic RSI oversold, and neutral RSI suggesting emerging but unconfirmed bullish momentum.
- Key support is at $230.38 and resistance at $242.63, with a 74% probability the stock trades within $234.01 to $287.7 in the next five days.
AI expansion and buyback authorization fuel bullish sentiment ahead of the week
CRM set ambitious long-term revenue targets at its Dreamforce 2026 conference, aiming for more than $63 billion by fiscal 2030 according to Yahoo Finance and GuruFocus, lifting sentiment around growth prospects into the week ahead. The company also expanded its AI footprint with the debut of AIforce and new integrations with Anthropic, Google Cloud, and AWS, as reported by Info-Tech, Complete AI Training, and CX Today. Additional support came from a fresh $50 billion share buyback authorization, a 5.8% dividend increase, and director David Kirk's $1 million insider purchase on September 21, 2026, according to Investing.com and Benzinga.
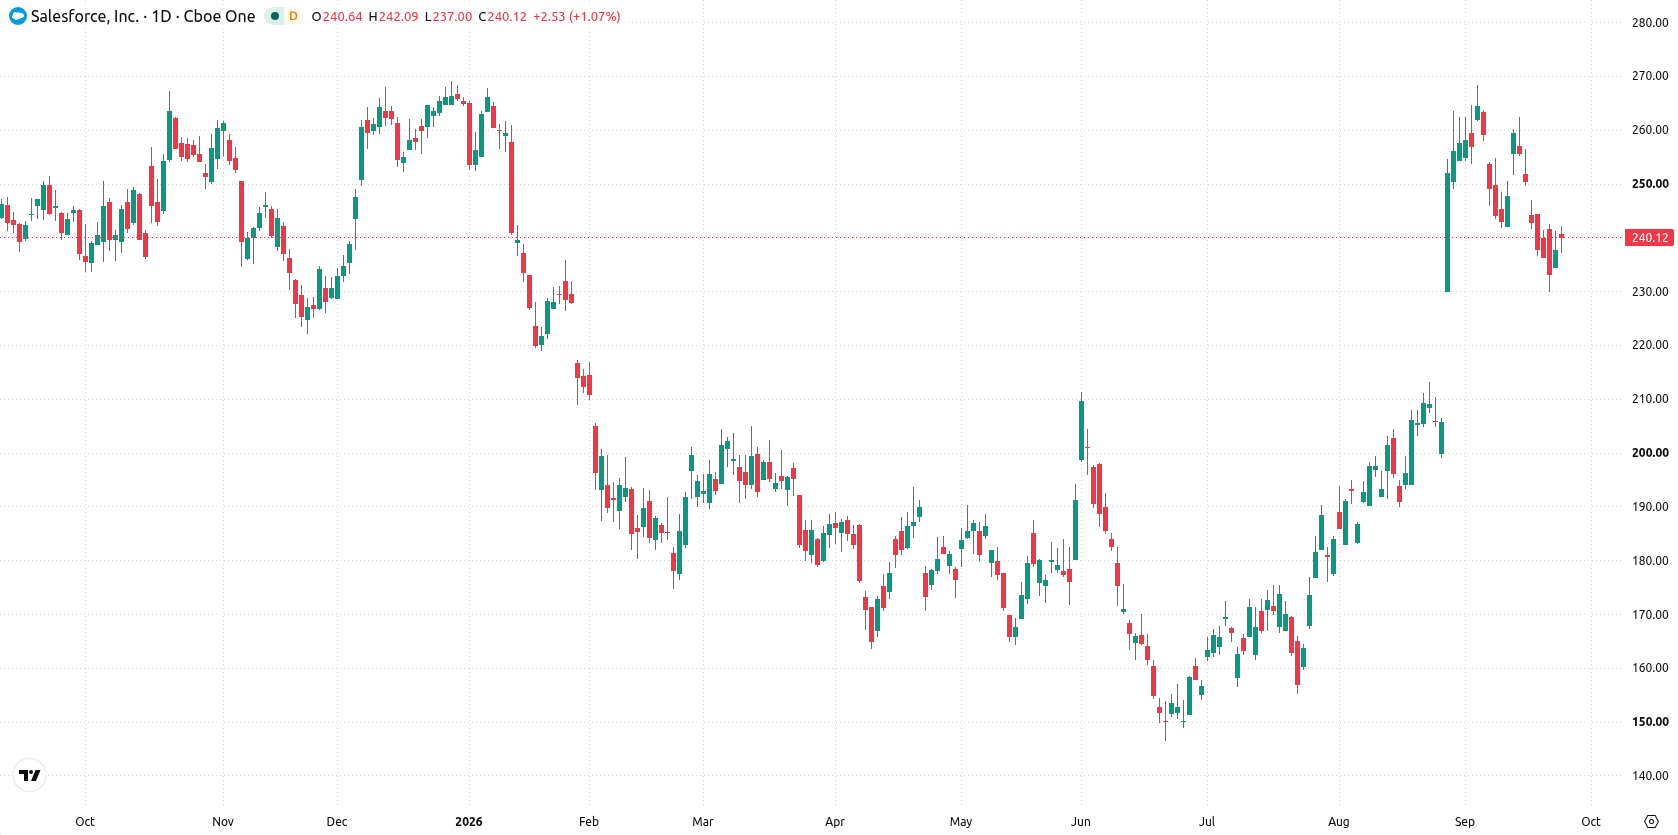
Bullish potential emerges as stochastics cross oversold with unconfirmed breakout
The daily chart suggests a developing move, with volatility at 5.58% and momentum showing mixed signals. The MACD points to a strong buy, while Stochastic RSI is oversold at 9.23, indicating emerging bullish potential, though RSI remains neutral. Initial support stands at $230.38, marked by the Ichimoku Kijun, and resistance is seen at $242.63. This setup points to an emerging move higher that is not yet confirmed and will likely depend on upcoming tests of these key levels.
Bullish bias prevails in coming week pending break of key resistance
For the next five trading days, the expected range is $234.01 to $287.7. The probability of an increase is 74%, versus a 26% chance of a decrease. The base case envisions Salesforce stock trading between support at $230.38 and resistance at $242.63. A bullish break above $242.63 could open the way to a further move toward the upper end of the forecast, while a drop below $230.38 would weaken the outlook and likely shift momentum in favor of the sellers.
Previously it was reported that Salesforce faced heightened volatility and mixed technical signals, prompting a cautious outlook as the stock remained range-bound. The current article strengthens this view with new evidence of conflicting momentum indicators and highlights $242.63 as the key resistance level to monitor for signs of a breakout in the coming sessions.










-
 Afghanistan
-
 Albania
-
 Algeria
-
 Angola
-
 Argentina
-
 Armenia
-
 Australia
-
 Austria
-
 Azerbaijan
-
 Bahamas
-
 Bahrain
-
 Bangladesh
-
 Belarus
-
 Belgium
-
 Bolivia
-
 Botswana
-
 Brazil
-
 Brunei
-
 Bulgaria
-
 Cambodia
-
 Cameroon
-
 Canada
-
 Chile
-
 China
-
 Colombia
-
 Congo
-
 Costa Rica
-
 Cote d'Ivoire
-
 Croatia
-
 Cuba
-
 Cyprus
-
 Czechia
-
 DR Congo
-
 Denmark
-
 Dominican Republic
-
 Ecuador
-
 Egypt
-
 El Salvador
-
 Estonia
-
 Eswatini
-
 Ethiopia
-
 Finland
-
 France
-
 Georgia
-
 Germany
-
 Ghana
-
 Greece
-
 Haiti
-
 Hong Kong
-
 Hungary
-
 India
-
 Indonesia
-
 Iran, Islamic republic
-
 Iraq
-
 Ireland
-
 Israel
-
 Italy
-
 Jamaica
-
 Japan
-
 Jordan
-
 Kazakhstan
-
 Kenya
-
 Korea
-
 Kuwait
-
 Kyrgyzstan
-
 Laos
-
 Latvia
-
 Lebanon
-
 Lesotho
-
 Libya
-
 Lithuania
-
 Luxembourg
-
 Madagascar
-
 Malaysia
-
 Malta
-
 Mauritius
-
 Mexico
-
 Moldova
-
 Mongolia
-
 Montenegro
-
 Morocco
-
 Mozambique
-
 Myanmar
-
 Namibia
-
 Nepal
-
 Netherlands
-
 New Zealand
-
 Nigeria
-
 North Macedonia
-
 Norway
-
 Oman
-
 Pakistan
-
 Palestine
-
 Panama
-
 Papua New Guinea
-
 Paraguay
-
 Peru
-
 Philippines
-
 Poland
-
 Portugal
-
 Puerto Rico
-
 Qatar
-
 Reunion
-
 Romania
-
 Rwanda
-
 Saudi Arabia
-
 Serbia
-
 Singapore
-
 Slovakia
-
 Slovenia
-
 Somalia
-
 South Africa
-
 Spain
-
 Sri Lanka
-
 Sweden
-
 Switzerland
-
 Syria
-
 Taiwan
-
 Tajikistan
-
 Tanzania
-
 Thailand
-
 Trinidad and Tobago
-
 Tunisia
-
 Turkey
-
 UAE
-
 Uganda
-
 Ukraine
-
 United Kingdom
-
United States
-
 Uruguay
-
 Uzbekistan
-
 Venezuela
-
 Vietnam
-
 Yemen
-
 Zambia
-
 Zimbabwe
- Forex
- Crypto












