

TELUS stock support test at C$11.65: Key levels to watch

TELUS (T) stock is trading at C$11.91 after slipping slightly lower today. The price remains below its key moving averages, reflecting persistent pressure over multiple timeframes.
 13.25
13.25
Highlights
- TELUS cut its quarterly dividend by 55% to C$0.1875 per share to prioritize debt reduction over shareholder payouts.
- The company projects C$2.7 billion in cash savings from the dividend cut through 2028, aiming for a stronger balance sheet.
- TELUS stock trades below key moving averages with negative momentum, likely consolidating between C$11.65 and C$12.17 as downside pressure persists.
Dividend cut drives deleveraging focus despite sustained equity outflows
On July 31, 2026, TELUS reset its quarterly dividend 55% lower to C$0.1875 per share, shifting capital allocation from shareholder payouts to debt reduction, according to Kalkine. This move is projected by the company to deliver about C$2.7 billion in cash savings through 2028, enabling a stronger balance sheet over the medium term. While the dividend cut limits direct income for investors, it reflects a focus on deleveraging at the expense of immediate yield, though price action has remained under broader selling pressure.
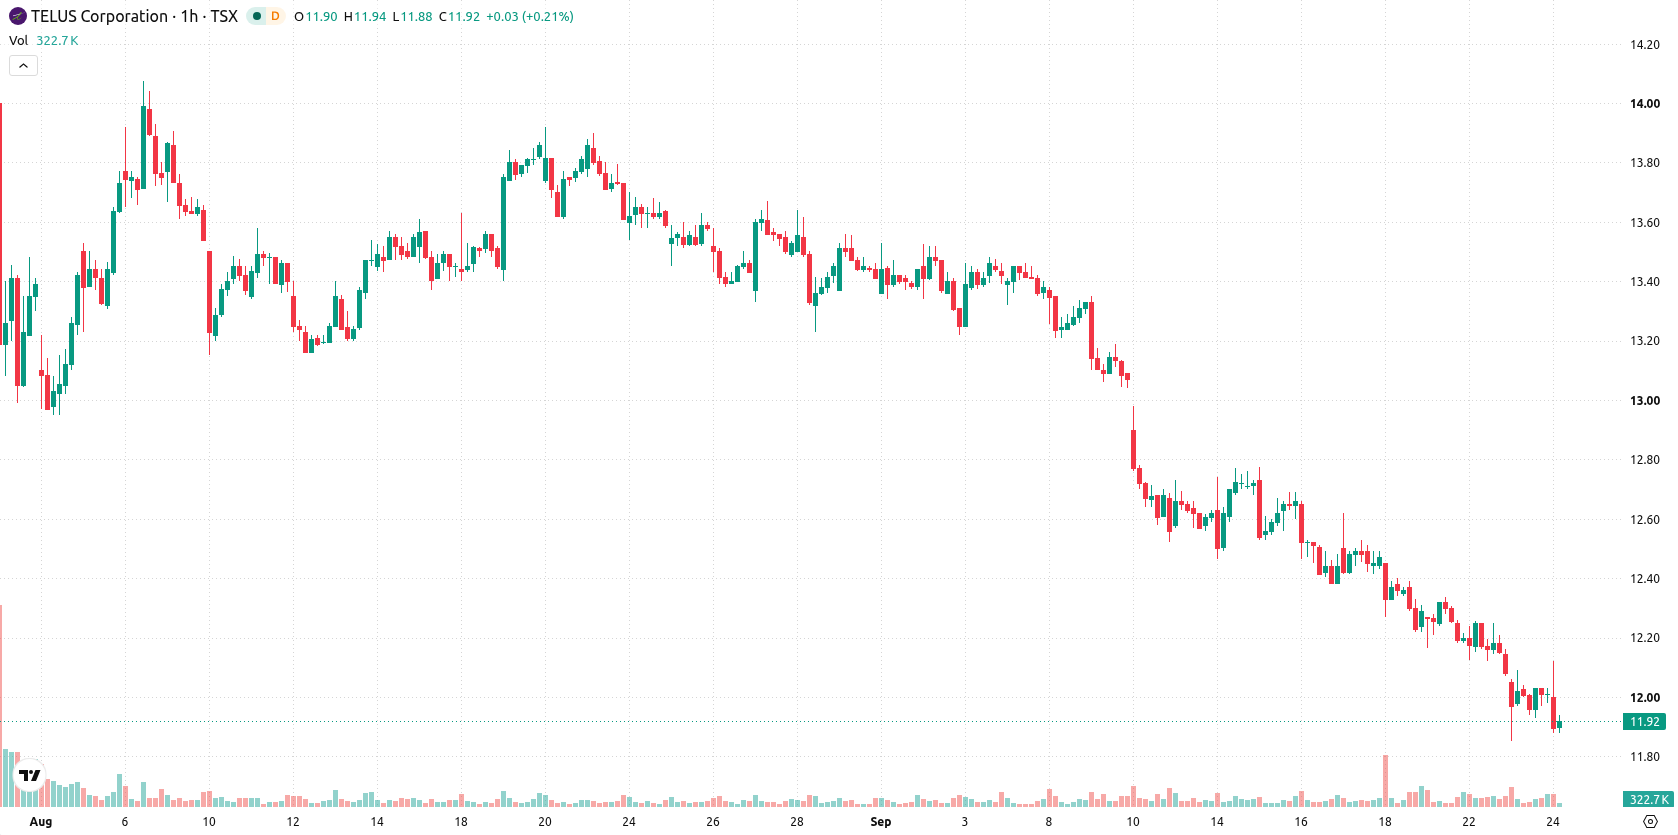
Seller momentum intensifies as resistance holds and oscillators diverge
T is below its MA-20 (C$12.14) and MA-50 (C$12.34) on the hourly chart, while the daily price holds far below the MA-200 at C$16.57. The Ichimoku Kijun at C$12.13 acts as immediate resistance. Momentum remains negative, with MACD, ADX, CCI, and Bull/Bear Power all showing seller control intraday. RSI prints 37.76 (Sell zone), while Stoch RSI signals an overbought bounce, creating some short-term divergence among oscillators. AO remains neutral and does not confirm a directional setup.
Range-bound outlook as breakout risk declines amid muted sentiment
Over the coming trading days, T is expected to consolidate within the C$11.65 to C$12.17 band, a typical volatility range given current market dynamics. The likelihood of an upward breakout is considered very low, while continuation below C$11.65 would confirm renewed weakness. A bullish scenario would require a close above C$12.13, potentially targeting higher levels, but the baseline forecast remains for sideways or lower price action inside the marked corridor.
Earlier, analysts noted that TELUS shares faced persistent downside momentum and risk, with negative technical signals dominating the outlook. The present analysis reinforces this cautious stance, flagging C$11.65 as a critical support level for traders monitoring further downside or potential shifts in trend.










-
 Afghanistan
-
 Albania
-
 Algeria
-
 Angola
-
 Argentina
-
 Armenia
-
 Australia
-
 Austria
-
 Azerbaijan
-
 Bahamas
-
 Bahrain
-
 Bangladesh
-
 Belarus
-
 Belgium
-
 Bolivia
-
 Botswana
-
 Brazil
-
 Brunei
-
 Bulgaria
-
 Cambodia
-
 Cameroon
-
 Canada
-
 Chile
-
 China
-
 Colombia
-
 Congo
-
 Costa Rica
-
 Cote d'Ivoire
-
 Croatia
-
 Cuba
-
 Cyprus
-
 Czechia
-
 DR Congo
-
 Denmark
-
 Dominican Republic
-
 Ecuador
-
 Egypt
-
 El Salvador
-
 Estonia
-
 Eswatini
-
 Ethiopia
-
 Finland
-
 France
-
 Georgia
-
 Germany
-
 Ghana
-
 Greece
-
 Haiti
-
 Hong Kong
-
 Hungary
-
 India
-
 Indonesia
-
 Iran, Islamic republic
-
 Iraq
-
 Ireland
-
 Israel
-
 Italy
-
 Jamaica
-
 Japan
-
 Jordan
-
 Kazakhstan
-
 Kenya
-
 Korea
-
 Kuwait
-
 Kyrgyzstan
-
 Laos
-
 Latvia
-
 Lebanon
-
 Lesotho
-
 Libya
-
 Lithuania
-
 Luxembourg
-
 Madagascar
-
 Malaysia
-
 Malta
-
 Mauritius
-
 Mexico
-
 Moldova
-
 Mongolia
-
 Montenegro
-
 Morocco
-
 Mozambique
-
 Myanmar
-
 Namibia
-
 Nepal
-
 Netherlands
-
 New Zealand
-
 Nigeria
-
 North Macedonia
-
 Norway
-
 Oman
-
 Pakistan
-
 Palestine
-
 Panama
-
 Papua New Guinea
-
 Paraguay
-
 Peru
-
 Philippines
-
 Poland
-
 Portugal
-
 Puerto Rico
-
 Qatar
-
 Reunion
-
 Romania
-
 Rwanda
-
 Saudi Arabia
-
 Serbia
-
 Singapore
-
 Slovakia
-
 Slovenia
-
 Somalia
-
 South Africa
-
 Spain
-
 Sri Lanka
-
 Sweden
-
 Switzerland
-
 Syria
-
 Taiwan
-
 Tajikistan
-
 Tanzania
-
 Thailand
-
 Trinidad and Tobago
-
 Tunisia
-
 Turkey
-
 UAE
-
 Uganda
-
 Ukraine
-
 United Kingdom
-
United States
-
 Uruguay
-
 Uzbekistan
-
 Venezuela
-
 Vietnam
-
 Yemen
-
 Zambia
-
 Zimbabwe
- Forex
- Crypto












