

Why is Hims & Hers Health stock down today? Sellers dominate short-term trend; key levels to watch

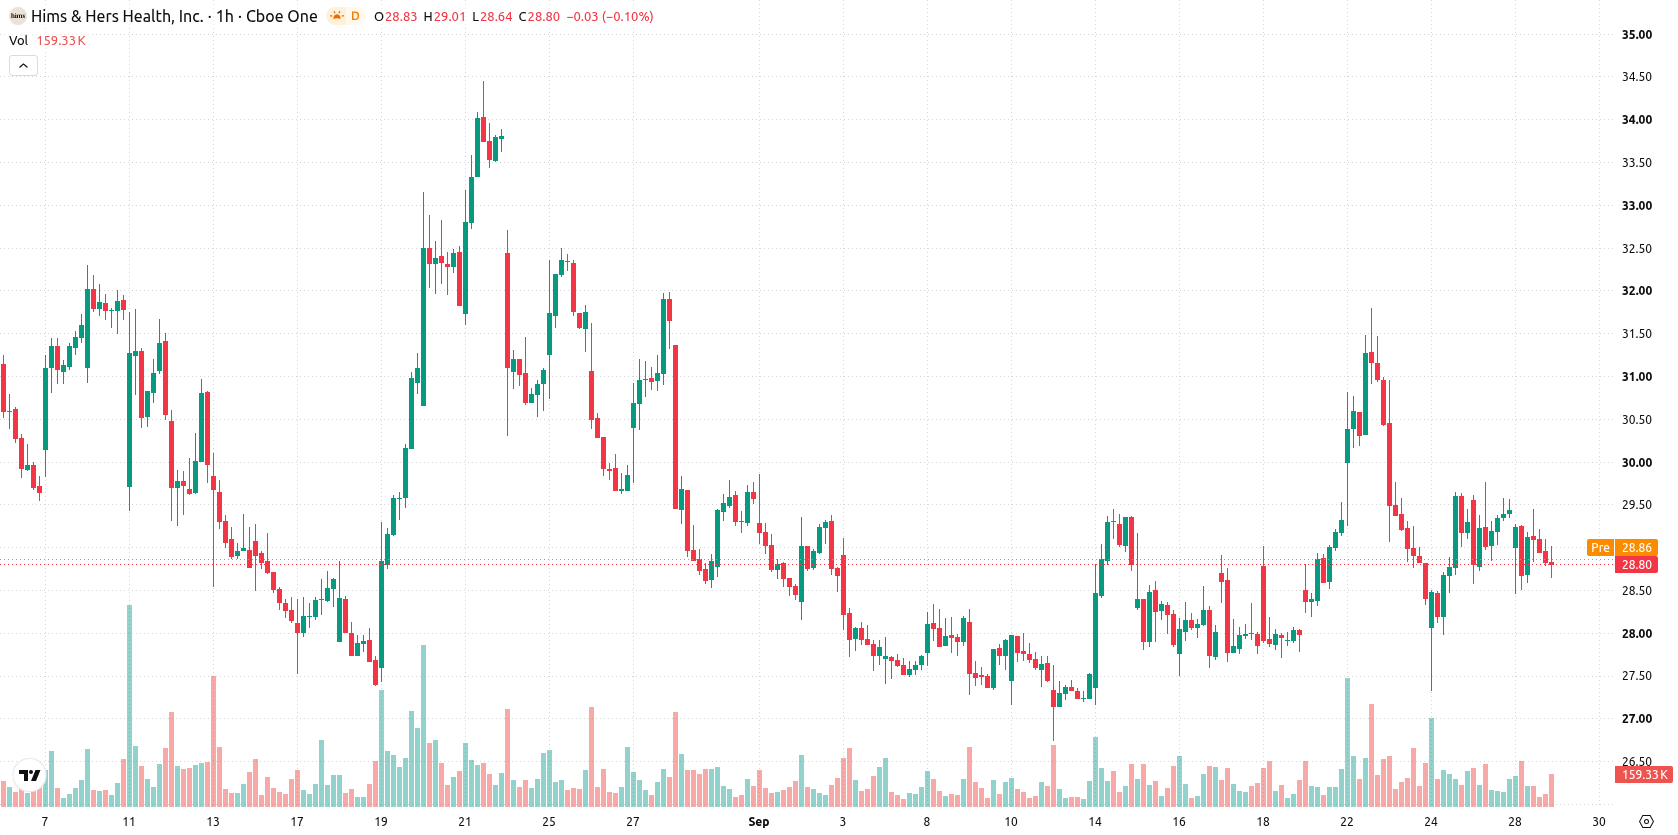
Hims & Hers Health (HIMS) stock is trading at $28.78 after closing down 2.19% for the session. Shares remain under key short- and medium-term moving averages but above longer-term levels, marking a pronounced negative daily move within a higher volatility backdrop.
 20.16
25.62
Highlights
- Shares of HIMS/USD remain under persistent selling pressure, trading below short and medium-term moving averages.
- Bearish momentum dominates with most indicators signaling downside, although Stoch RSI is in oversold territory with no confirmed reversal.
- Expected price moves in the next 2 to 3 days are between $26.81 and $30.75, with a much higher likelihood of further downside.
Downside momentum persists as short-term barriers dominate
On the technical front, HIMS is trading below the MA-20 ($29.05) and MA-50 ($29.06) on the hourly chart, while remaining above the MA-200 ($27.7) on the daily timeframe. The Ichimoku Kijun line at $28.54 acts as immediate support. Momentum indicators reflect persistent downside: MACD and RSI (44.84) both confirm selling pressure, Stoch RSI signals oversold conditions, and CCI issues a sell reading. ADX is neutral, and Bull/Bear Power points to dominant seller control intraday.
Further downside risk elevated amid low reversal chances
Looking ahead to the next 2–3 trading sessions, HIMS is expected to fluctuate within the $26.81–$30.75 price band. The likelihood of a short-term upward reversal is very low, while the chance of further downside is described as very high. If immediate support around the Ichimoku Kijun holds, the baseline scenario is range-bound trading. A break above resistance could prompt a test of upper price targets, whereas a move below support exposes the lower end of the forecast volatility range.
Earlier, analysts noted that Hims & Hers Health was encountering heightened regulatory and litigation risks alongside cautious technical signals, leading to expectations of continued price consolidation. The latest technical breakdown and reinforced downside momentum underscore increased risk within the current volatility band, making sustained support at the Ichimoku Kijun line a critical level to monitor for potential further declines.






Latest Hims & Hers News





-
 Afghanistan
-
 Albania
-
 Algeria
-
 Angola
-
 Argentina
-
 Armenia
-
 Australia
-
 Austria
-
 Azerbaijan
-
 Bahamas
-
 Bahrain
-
 Bangladesh
-
 Belarus
-
 Belgium
-
 Bolivia
-
 Botswana
-
 Brazil
-
 Brunei
-
 Bulgaria
-
 Cambodia
-
 Cameroon
-
 Canada
-
 Chile
-
 China
-
 Colombia
-
 Congo
-
 Costa Rica
-
 Cote d'Ivoire
-
 Croatia
-
 Cuba
-
 Cyprus
-
 Czechia
-
 DR Congo
-
 Denmark
-
 Dominican Republic
-
 Ecuador
-
 Egypt
-
 El Salvador
-
 Estonia
-
 Eswatini
-
 Ethiopia
-
 Finland
-
 France
-
 Georgia
-
 Germany
-
 Ghana
-
 Greece
-
 Haiti
-
 Hong Kong
-
 Hungary
-
 India
-
 Indonesia
-
 Iran, Islamic republic
-
 Iraq
-
 Ireland
-
 Israel
-
 Italy
-
 Jamaica
-
 Japan
-
 Jordan
-
 Kazakhstan
-
 Kenya
-
 Korea
-
 Kuwait
-
 Kyrgyzstan
-
 Laos
-
 Latvia
-
 Lebanon
-
 Lesotho
-
 Libya
-
 Lithuania
-
 Luxembourg
-
 Madagascar
-
 Malaysia
-
 Malta
-
 Mauritius
-
 Mexico
-
 Moldova
-
 Mongolia
-
 Montenegro
-
 Morocco
-
 Mozambique
-
 Myanmar
-
 Namibia
-
 Nepal
-
 Netherlands
-
 New Zealand
-
 Nigeria
-
 North Macedonia
-
 Norway
-
 Oman
-
 Pakistan
-
 Palestine
-
 Panama
-
 Papua New Guinea
-
 Paraguay
-
 Peru
-
 Philippines
-
 Poland
-
 Portugal
-
 Puerto Rico
-
 Qatar
-
 Reunion
-
 Romania
-
 Rwanda
-
 Saudi Arabia
-
 Serbia
-
 Singapore
-
 Slovakia
-
 Slovenia
-
 Somalia
-
 South Africa
-
 Spain
-
 Sri Lanka
-
 Sweden
-
 Switzerland
-
 Syria
-
 Taiwan
-
 Tajikistan
-
 Tanzania
-
 Thailand
-
 Trinidad and Tobago
-
 Tunisia
-
 Turkey
-
 UAE
-
 Uganda
-
 Ukraine
-
 United Kingdom
-
United States
-
 Uruguay
-
 Uzbekistan
-
 Venezuela
-
 Vietnam
-
 Yemen
-
 Zambia
-
 Zimbabwe
- Forex
- Crypto












