

IBM shares weekly forecast: Resistance at the 50-day moving average caps recovery attempts

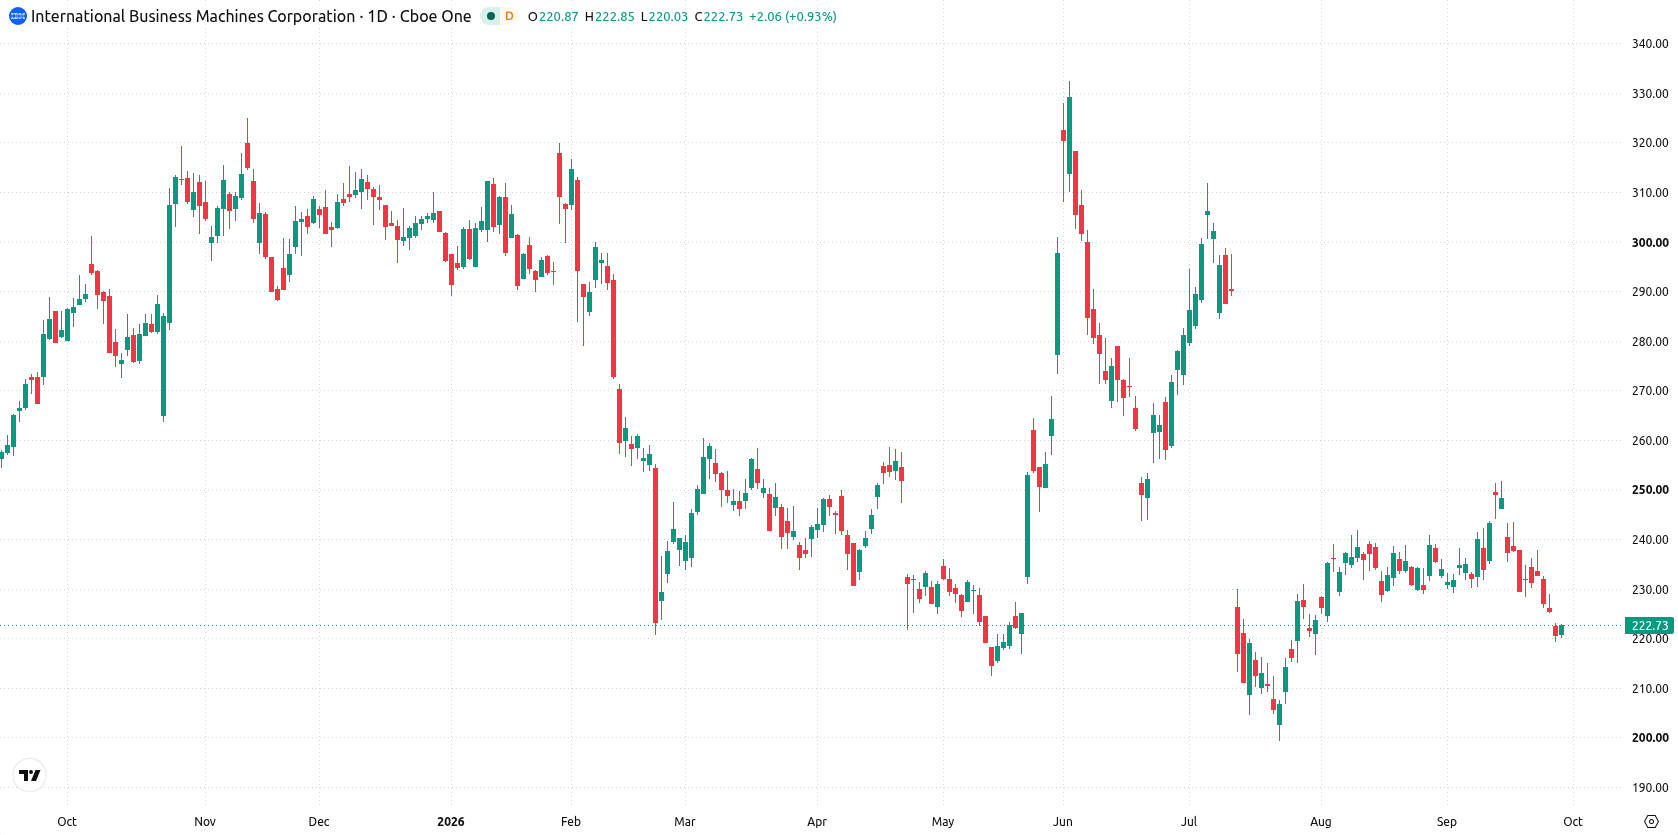
Shares of International Business Machines Corporation (IBM) are trading near $223 after falling more than 1% last week, as support comes into focus following an extended sell-off. Corporate updates and product moves shape expectations for the next week, with attention on whether prices will stabilize or continue to test lower levels.
 259.84
Highlights
- Shares of IBM have declined to $222.79 over the past week and remain below key short-term moving averages.
- Technical indicators show oversold conditions and ongoing downside pressure, with momentum remaining weak and no reversal signals present.
- The range for the next five trading days is projected between $214.58 and $230.99, with a higher probability of further losses.
Product expansion and recurring revenue guide sentiment as dividend debate lingers
IBM announced on September 24, 2026, the expansion of its digital asset infrastructure, enabling clients to interact with permissioned blockchain networks such as Swift’s shared ledger, according to PR Newswire. Additionally, the company continues to highlight growth in recurring software revenue, as reported by Pluang. Dividend sustainability remains a background topic, while a recent roundup from finanzen.ch noted that a one-year investment in IBM shares would have resulted in a loss, excluding dividends and stock splits.
Oversold signals intensify as weak weekly momentum drives downside risk
The daily setup shows a flat trend with a sharp move lower without a sustained trend, as volatility over the past week reached 8.37%. RSI is approaching oversold at 37.81, while both CCI and Stochastic RSI are deeply oversold, signaling lingering downside pressure. Nearest support is seen at $219.23, with resistance at the 50-day moving average of $230.83 and the Ichimoku Kijun at $235.49 acting as an additional barrier above. This technical alignment points to continued downside risk, with weak momentum and few signs of reversal so far.
Consolidation base expected as downside bias dominates next week’s scenarios
For the next five trading days, the expected range is $214.58 to $230.99. There is a 22% probability of an increase and a 78% probability of a decrease. The base case is for IBM shares to consolidate between $219.23 support and resistance at $230.83. A move above $230.83 would open the door to a test of higher resistance, while a drop below $219.23 could see the stock extend losses toward the lower bound of the expected range.
Earlier, analysts noted that IBM remained under bearish momentum, constrained by weak technical conditions despite efforts to expand its digital banking infrastructure. With current technical signals still pointing to downside risk, traders should monitor $219.23 as a key support level for potential further declines in the coming sessions.










-
 Afghanistan
-
 Albania
-
 Algeria
-
 Angola
-
 Argentina
-
 Armenia
-
 Australia
-
 Austria
-
 Azerbaijan
-
 Bahamas
-
 Bahrain
-
 Bangladesh
-
 Belarus
-
 Belgium
-
 Bolivia
-
 Botswana
-
 Brazil
-
 Brunei
-
 Bulgaria
-
 Cambodia
-
 Cameroon
-
 Canada
-
 Chile
-
 China
-
 Colombia
-
 Congo
-
 Costa Rica
-
 Cote d'Ivoire
-
 Croatia
-
 Cuba
-
 Cyprus
-
 Czechia
-
 DR Congo
-
 Denmark
-
 Dominican Republic
-
 Ecuador
-
 Egypt
-
 El Salvador
-
 Estonia
-
 Eswatini
-
 Ethiopia
-
 Finland
-
 France
-
 Georgia
-
 Germany
-
 Ghana
-
 Greece
-
 Haiti
-
 Hong Kong
-
 Hungary
-
 India
-
 Indonesia
-
 Iran, Islamic republic
-
 Iraq
-
 Ireland
-
 Israel
-
 Italy
-
 Jamaica
-
 Japan
-
 Jordan
-
 Kazakhstan
-
 Kenya
-
 Korea
-
 Kuwait
-
 Kyrgyzstan
-
 Laos
-
 Latvia
-
 Lebanon
-
 Lesotho
-
 Libya
-
 Lithuania
-
 Luxembourg
-
 Madagascar
-
 Malaysia
-
 Malta
-
 Mauritius
-
 Mexico
-
 Moldova
-
 Mongolia
-
 Montenegro
-
 Morocco
-
 Mozambique
-
 Myanmar
-
 Namibia
-
 Nepal
-
 Netherlands
-
 New Zealand
-
 Nigeria
-
 North Macedonia
-
 Norway
-
 Oman
-
 Pakistan
-
 Palestine
-
 Panama
-
 Papua New Guinea
-
 Paraguay
-
 Peru
-
 Philippines
-
 Poland
-
 Portugal
-
 Puerto Rico
-
 Qatar
-
 Reunion
-
 Romania
-
 Rwanda
-
 Saudi Arabia
-
 Serbia
-
 Singapore
-
 Slovakia
-
 Slovenia
-
 Somalia
-
 South Africa
-
 Spain
-
 Sri Lanka
-
 Sweden
-
 Switzerland
-
 Syria
-
 Taiwan
-
 Tajikistan
-
 Tanzania
-
 Thailand
-
 Trinidad and Tobago
-
 Tunisia
-
 Turkey
-
 UAE
-
 Uganda
-
 Ukraine
-
 United Kingdom
-
United States
-
 Uruguay
-
 Uzbekistan
-
 Venezuela
-
 Vietnam
-
 Yemen
-
 Zambia
-
 Zimbabwe
- Forex
- Crypto












