

What's behind IBM's latest 2.6% stock pullback?

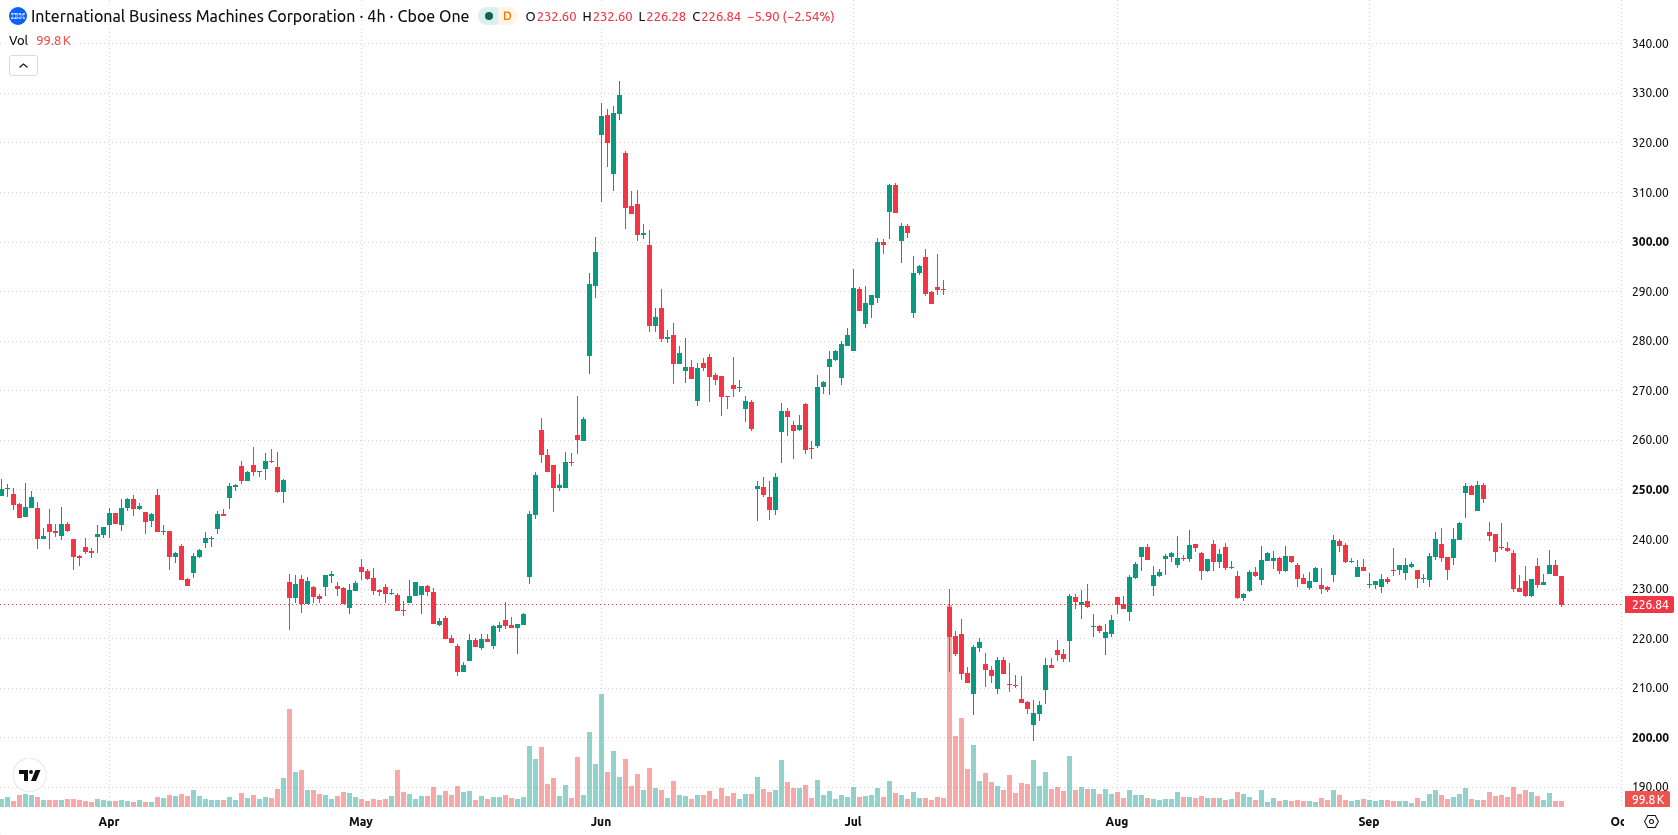
International Business Machines Corporation (IBM) fell 2.65% as near-term selling pressure overshadowed its recent digital banking infrastructure expansion. The move is supported by bearish technicals, with IBM trading below its 20-day, 50-day, and 200-day moving averages and facing sustained resistance.
 259.59
Highlights
- IBM expanded its digital banking infrastructure, integrating Swift and deploying its Digital Asset Haven solution on-premises.
- The company remains focused on advancing digital banking and asset management, with no new material or financial events reported.
- Shares of IBM remain under broad selling pressure, trading below key moving averages, with price expected to consolidate between $221.87 and $231.33 over the next five days.
Broader selling persists despite digital asset integration announcement
IBM announced the expansion of its digital banking infrastructure, integrating Swift and deploying its Digital Asset Haven solution on-premises, according to a press release dated September 24, 2026. This development demonstrates the company's continued focus on advancing its capabilities in digital banking and asset management services. No additional material or financial events directly concerning IBM were identified in the reviewed news items, though price action has remained under broader selling pressure.
Bearish momentum endures as mixed technicals cap upside potential
IBM is trading below its 20-day, 50-day, and 200-day moving averages ($235.97, $230.23, and $258.54), reflecting a bearish structure for both the short- and long-term outlook. The stock encounters resistance at $228.4, with support at $221.87, and the Ichimoku Kijun at $240.05 reinforcing downward pressure. Momentum indicators are mixed: MACD and ADX both show neutral momentum. RSI registers at 47.7 and signals sell, whereas the Stochastic RSI is low at 22.12 and points to a strong buy. Commodity Channel Index (CCI) at -22.88 remains neutral. Bull/Bear Power (BBP) is 2.3, indicating intraday buyer dominance, yet the overbought condition suggests further upside is limited. IBM is trading near the session low in a tight intraday range, with volatility at just 0.24%, reflecting post-open selling pressure.
Earlier, analysts noted that IBM's technical setup was improving but still required confirmation to signal a sustainable recovery relative to its sector peers. The current sustained trading below major moving averages and the high probability of further downside suggest that bearish momentum remains dominant, making a move below support at $221.87 the key risk for traders to monitor in the near term.










-
 Afghanistan
-
 Albania
-
 Algeria
-
 Angola
-
 Argentina
-
 Armenia
-
 Australia
-
 Austria
-
 Azerbaijan
-
 Bahamas
-
 Bahrain
-
 Bangladesh
-
 Belarus
-
 Belgium
-
 Bolivia
-
 Botswana
-
 Brazil
-
 Brunei
-
 Bulgaria
-
 Cambodia
-
 Cameroon
-
 Canada
-
 Chile
-
 China
-
 Colombia
-
 Congo
-
 Costa Rica
-
 Cote d'Ivoire
-
 Croatia
-
 Cuba
-
 Cyprus
-
 Czechia
-
 DR Congo
-
 Denmark
-
 Dominican Republic
-
 Ecuador
-
 Egypt
-
 El Salvador
-
 Estonia
-
 Eswatini
-
 Ethiopia
-
 Finland
-
 France
-
 Georgia
-
 Germany
-
 Ghana
-
 Greece
-
 Haiti
-
 Hong Kong
-
 Hungary
-
 India
-
 Indonesia
-
 Iran, Islamic republic
-
 Iraq
-
 Ireland
-
 Israel
-
 Italy
-
 Jamaica
-
 Japan
-
 Jordan
-
 Kazakhstan
-
 Kenya
-
 Korea
-
 Kuwait
-
 Kyrgyzstan
-
 Laos
-
 Latvia
-
 Lebanon
-
 Lesotho
-
 Libya
-
 Lithuania
-
 Luxembourg
-
 Madagascar
-
 Malaysia
-
 Malta
-
 Mauritius
-
 Mexico
-
 Moldova
-
 Mongolia
-
 Montenegro
-
 Morocco
-
 Mozambique
-
 Myanmar
-
 Namibia
-
 Nepal
-
 Netherlands
-
 New Zealand
-
 Nigeria
-
 North Macedonia
-
 Norway
-
 Oman
-
 Pakistan
-
 Palestine
-
 Panama
-
 Papua New Guinea
-
 Paraguay
-
 Peru
-
 Philippines
-
 Poland
-
 Portugal
-
 Puerto Rico
-
 Qatar
-
 Reunion
-
 Romania
-
 Rwanda
-
 Saudi Arabia
-
 Serbia
-
 Singapore
-
 Slovakia
-
 Slovenia
-
 Somalia
-
 South Africa
-
 Spain
-
 Sri Lanka
-
 Sweden
-
 Switzerland
-
 Syria
-
 Taiwan
-
 Tajikistan
-
 Tanzania
-
 Thailand
-
 Trinidad and Tobago
-
 Tunisia
-
 Turkey
-
 UAE
-
 Uganda
-
 Ukraine
-
 United Kingdom
-
United States
-
 Uruguay
-
 Uzbekistan
-
 Venezuela
-
 Vietnam
-
 Yemen
-
 Zambia
-
 Zimbabwe
- Forex
- Crypto












