

Class action lawsuit threat: Can ASTS hold the $56.33 support level?

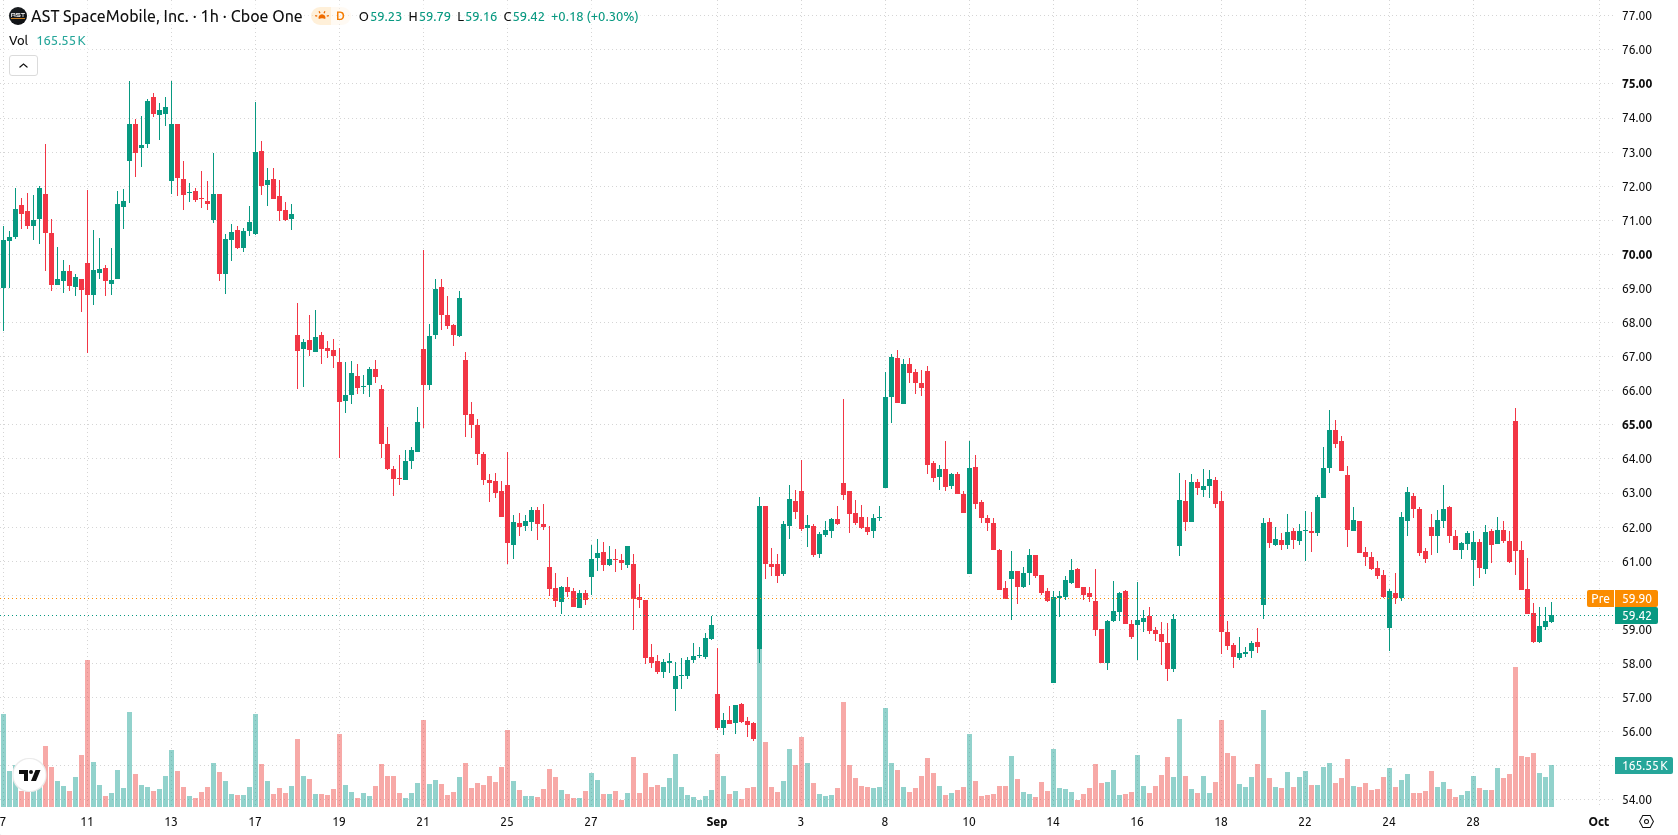
AST SpaceMobile (ASTS) stock is trading at $59.4 after a 2.71% decline on the day, closing near its session low. The price remains below its key moving averages, highlighting persistent downward momentum.
 33.16
40.86
Highlights
- AST SpaceMobile posted an adjusted loss of $0.77 per share on revenue of $31.52 million, both below consensus estimates.
- A class action lawsuit over alleged false statements and a new senior management severance policy introduce potential legal and leadership instability.
- Shares of AST SpaceMobile trade below key moving averages, with indicators showing strong seller dominance and projected range of $56.33 to $62.47.
Legal risks and leadership uncertainty weigh on investor confidence
AST SpaceMobile reported an adjusted loss of $0.77 per share and revenue of $31.52 million, both falling short of consensus expectations, which has pressured valuation and weighed on investor sentiment. According to GlobeNewswire, the company is also facing a class action lawsuit alleging false or misleading statements about its capital structure, competitive position, and user adoption rates, introducing legal and reputational risks that can erode confidence. Separately, Benzinga noted the adoption of a new senior management change-of-control severance policy, which may fuel uncertainty over potential shifts in company leadership. The Chief Operating Officer's recent sale of 12,000 shares for $707,000 adds to cautious near-term sentiment.
Oversold signals as sellers dominate below major resistance
On the hourly chart, ASTS trades below the MA-20 at $61.01 and MA-50 at $61.48, with additional downside confirmation from the long-term MA-200 at $81.37. The Ichimoku Kijun sits at $61.95 as immediate resistance. Momentum indicators remain negative, as both MACD and the Awesome Oscillator are aligned on sell signals, while ADX is neutral, highlighting a lack of clear trend strength. RSI and Stochastic RSI signal oversold conditions, CCI is also in oversold territory, and Bull/Bear Power confirms strong seller dominance intraday.
Downside bias prevails amid high volatility and weak support
In the short term, ASTS is expected to consolidate within a range of $56.33 to $62.47, reflecting its current volatility band relative to ongoing conditions. There is an estimated 27% probability for an upward move, with a 73% likelihood of a further decline. Consolidation above $56.33 would signal stability, but a decisive break below this support may trigger deeper downside, while a move through resistance at $61.95 could prompt a test toward the upper bound of the projected range.
Earlier, analysts noted that AST SpaceMobile continued to face persistent volatility and unresolved longer-term momentum weaknesses amid legal and operational uncertainties. The current setup reinforces this cautious outlook, with ongoing consolidation suggesting traders should closely monitor the $56.33 support level for early signals of renewed downside risk.











-
 Afghanistan
-
 Albania
-
 Algeria
-
 Angola
-
 Argentina
-
 Armenia
-
 Australia
-
 Austria
-
 Azerbaijan
-
 Bahamas
-
 Bahrain
-
 Bangladesh
-
 Belarus
-
 Belgium
-
 Bolivia
-
 Botswana
-
 Brazil
-
 Brunei
-
 Bulgaria
-
 Cambodia
-
 Cameroon
-
 Canada
-
 Chile
-
 China
-
 Colombia
-
 Congo
-
 Costa Rica
-
 Cote d'Ivoire
-
 Croatia
-
 Cuba
-
 Cyprus
-
 Czechia
-
 DR Congo
-
 Denmark
-
 Dominican Republic
-
 Ecuador
-
 Egypt
-
 El Salvador
-
 Estonia
-
 Eswatini
-
 Ethiopia
-
 Finland
-
 France
-
 Georgia
-
 Germany
-
 Ghana
-
 Greece
-
 Haiti
-
 Hong Kong
-
 Hungary
-
 India
-
 Indonesia
-
 Iran, Islamic republic
-
 Iraq
-
 Ireland
-
 Israel
-
 Italy
-
 Jamaica
-
 Japan
-
 Jordan
-
 Kazakhstan
-
 Kenya
-
 Korea
-
 Kuwait
-
 Kyrgyzstan
-
 Laos
-
 Latvia
-
 Lebanon
-
 Lesotho
-
 Libya
-
 Lithuania
-
 Luxembourg
-
 Madagascar
-
 Malaysia
-
 Malta
-
 Mauritius
-
 Mexico
-
 Moldova
-
 Mongolia
-
 Montenegro
-
 Morocco
-
 Mozambique
-
 Myanmar
-
 Namibia
-
 Nepal
-
 Netherlands
-
 New Zealand
-
 Nigeria
-
 North Macedonia
-
 Norway
-
 Oman
-
 Pakistan
-
 Palestine
-
 Panama
-
 Papua New Guinea
-
 Paraguay
-
 Peru
-
 Philippines
-
 Poland
-
 Portugal
-
 Puerto Rico
-
 Qatar
-
 Reunion
-
 Romania
-
 Rwanda
-
 Saudi Arabia
-
 Serbia
-
 Singapore
-
 Slovakia
-
 Slovenia
-
 Somalia
-
 South Africa
-
 Spain
-
 Sri Lanka
-
 Sweden
-
 Switzerland
-
 Syria
-
 Taiwan
-
 Tajikistan
-
 Tanzania
-
 Thailand
-
 Trinidad and Tobago
-
 Tunisia
-
 Turkey
-
 UAE
-
 Uganda
-
 Ukraine
-
 United Kingdom
-
United States
-
 Uruguay
-
 Uzbekistan
-
 Venezuela
-
 Vietnam
-
 Yemen
-
 Zambia
-
 Zimbabwe
- Forex
- Crypto












