

Agnico Eagle Mines stock trades near C$261.56 support as failed breakout curbs momentum

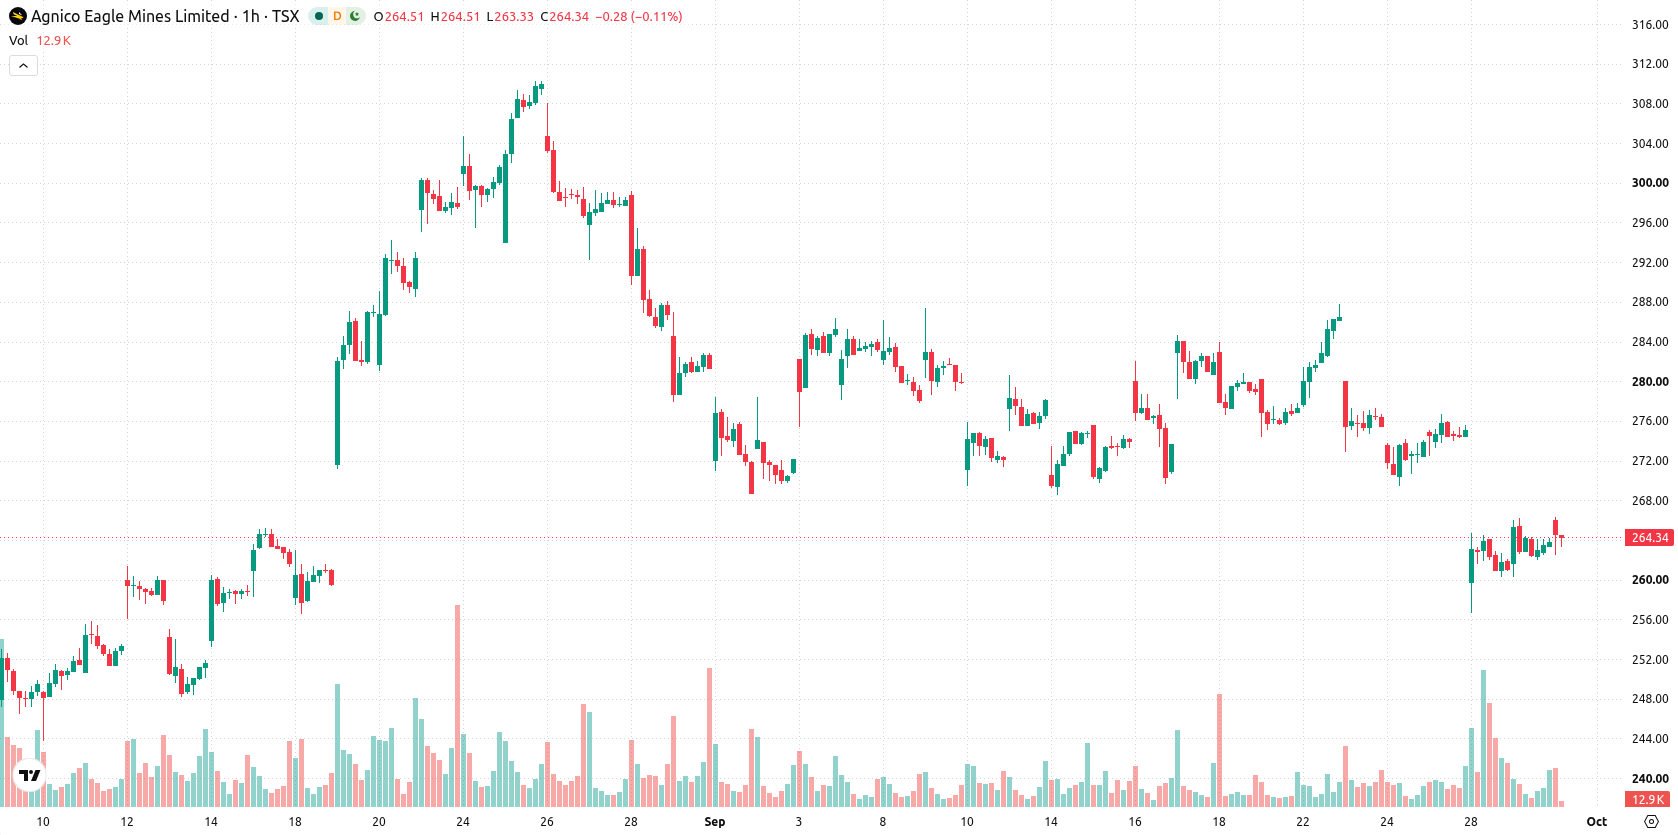
Agnico Eagle Mines (AEM) stock is trading at C$263, marking a modest decline on the day. The share price currently sits below its key short- and medium-term moving averages, but remains above longer-term support.
 235.79
256.51
Highlights
- AEM/CAD is trading below short- and medium-term moving averages, indicating sustained selling in the near term.
- Most momentum and trend indicators show a sell bias, with negative MACD and bearish ADX readings currently dominating.
- Price is projected to move between C$254.13 and C$271.87 in the next 2 to 3 days, with a 70% probability of further downside.
Bearish momentum indicated by mixed technical signals
On the hourly chart, AEM is trading below the MA-20 at C$266.49 and MA-50 at C$272.84, indicating a period of sustained pressure. On the daily chart, the price maintains a position above the MA-200 at C$261.56, offering a technical floor. The Ichimoku Kijun is situated at C$266.66 and acts as immediate resistance. Momentum indicators present a mixed picture: MACD signals a strong sell and ADX points to a sell bias, while RSI sits at 40.51, also suggesting a tendency to sell. Stoch RSI is overbought, CCI remains neutral, and Bull/Bear Power currently favors sellers in intraday dynamics.
Downside favored as volatility drives near-term range
Over the next two to three trading days, the price is projected to oscillate within a corridor from C$254.13 to C$271.87, reflecting typical volatility for the stock. There is a 70% probability of a downward move and 30% for an upward break. If AEM overcomes resistance at C$266.66, it could attempt a move toward the upper bound of the range. If support near C$261.56 fails, a test of the lower end of the band becomes likely.
Earlier, analysts noted that Agnico Eagle Mines was experiencing sustained downside risk amid ongoing technical weakness and consolidation. The current analysis reinforces this view, highlighting the importance of monitoring support at C$261.56 as a decisive level for the stock’s next move.










-
 Afghanistan
-
 Albania
-
 Algeria
-
 Angola
-
 Argentina
-
 Armenia
-
 Australia
-
 Austria
-
 Azerbaijan
-
 Bahamas
-
 Bahrain
-
 Bangladesh
-
 Belarus
-
 Belgium
-
 Bolivia
-
 Botswana
-
 Brazil
-
 Brunei
-
 Bulgaria
-
 Cambodia
-
 Cameroon
-
 Canada
-
 Chile
-
 China
-
 Colombia
-
 Congo
-
 Costa Rica
-
 Cote d'Ivoire
-
 Croatia
-
 Cuba
-
 Cyprus
-
 Czechia
-
 DR Congo
-
 Denmark
-
 Dominican Republic
-
 Ecuador
-
 Egypt
-
 El Salvador
-
 Estonia
-
 Eswatini
-
 Ethiopia
-
 Finland
-
 France
-
 Georgia
-
 Germany
-
 Ghana
-
 Greece
-
 Haiti
-
 Hong Kong
-
 Hungary
-
 India
-
 Indonesia
-
 Iran, Islamic republic
-
 Iraq
-
 Ireland
-
 Israel
-
 Italy
-
 Jamaica
-
 Japan
-
 Jordan
-
 Kazakhstan
-
 Kenya
-
 Korea
-
 Kuwait
-
 Kyrgyzstan
-
 Laos
-
 Latvia
-
 Lebanon
-
 Lesotho
-
 Libya
-
 Lithuania
-
 Luxembourg
-
 Madagascar
-
 Malaysia
-
 Malta
-
 Mauritius
-
 Mexico
-
 Moldova
-
 Mongolia
-
 Montenegro
-
 Morocco
-
 Mozambique
-
 Myanmar
-
 Namibia
-
 Nepal
-
 Netherlands
-
 New Zealand
-
 Nigeria
-
 North Macedonia
-
 Norway
-
 Oman
-
 Pakistan
-
 Palestine
-
 Panama
-
 Papua New Guinea
-
 Paraguay
-
 Peru
-
 Philippines
-
 Poland
-
 Portugal
-
 Puerto Rico
-
 Qatar
-
 Reunion
-
 Romania
-
 Rwanda
-
 Saudi Arabia
-
 Serbia
-
 Singapore
-
 Slovakia
-
 Slovenia
-
 Somalia
-
 South Africa
-
 Spain
-
 Sri Lanka
-
 Sweden
-
 Switzerland
-
 Syria
-
 Taiwan
-
 Tajikistan
-
 Tanzania
-
 Thailand
-
 Trinidad and Tobago
-
 Tunisia
-
 Turkey
-
 UAE
-
 Uganda
-
 Ukraine
-
 United Kingdom
-
United States
-
 Uruguay
-
 Uzbekistan
-
 Venezuela
-
 Vietnam
-
 Yemen
-
 Zambia
-
 Zimbabwe
- Forex
- Crypto












