

AppLovin shares technical analysis: Testing $285.15 support after AI claims lawsuits

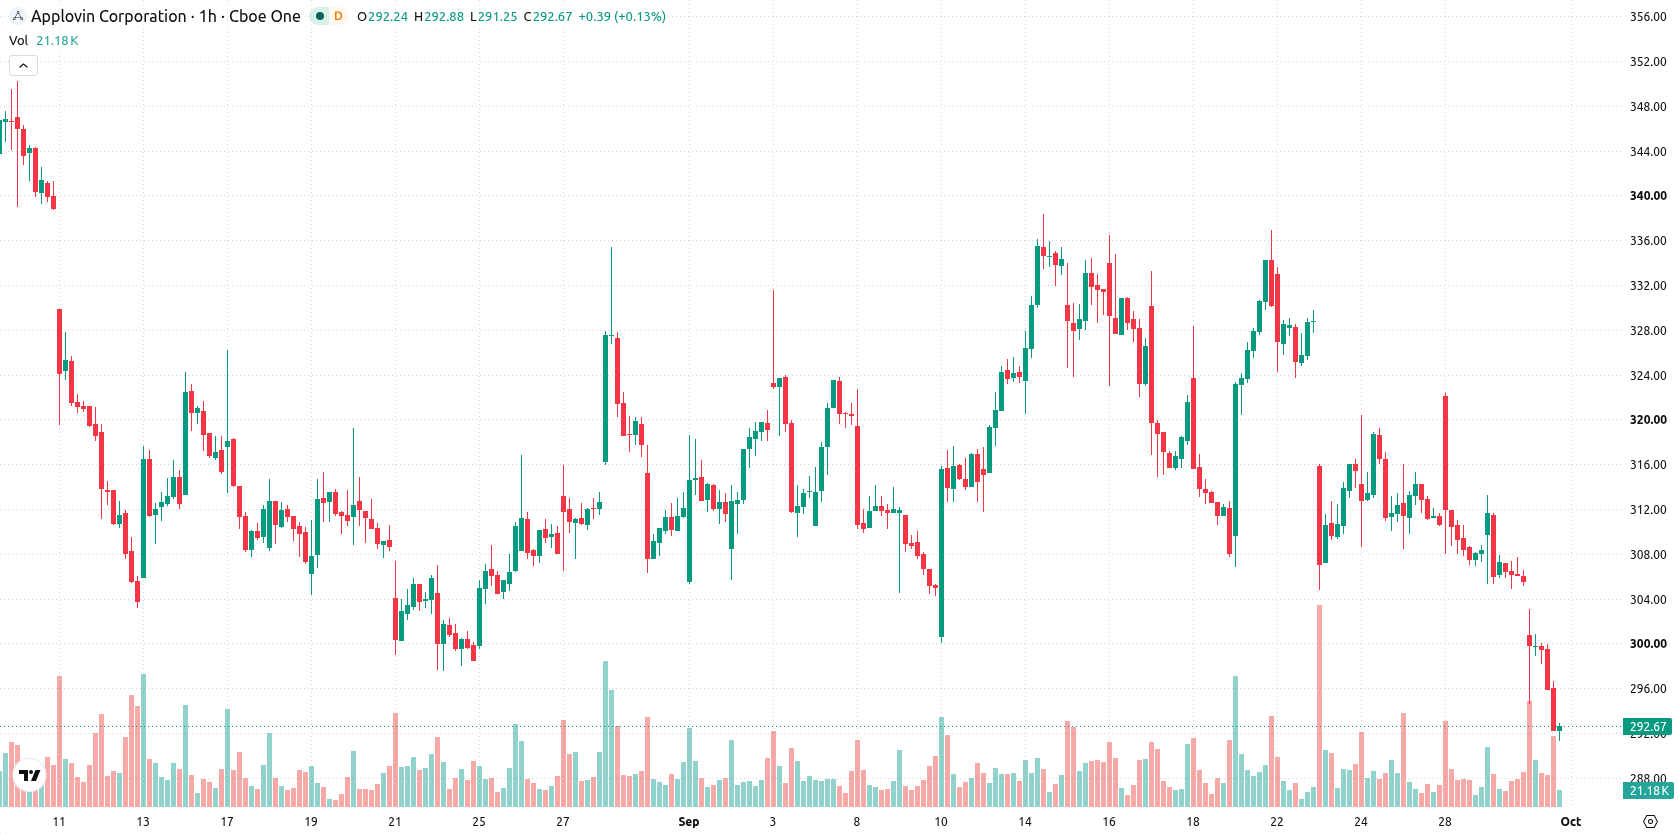
AppLovin (APP) stock is trading at $292.04, down 4.42% over the day. The price remains below its key moving averages, reflecting persistent selling pressure across recent sessions.
 242.56
263.89
Highlights
- AppLovin faces multiple securities class action lawsuits alleging misrepresentation of its AI advertising products' capabilities and timeline.
- The company reported Q2 2026 revenue of $1.92 billion, missing estimates, with its generative AI video tool still in development.
- Shares of AppLovin fell 4.42% to $292.04, trading below key moving averages, with high downside risk and an expected range of $285.15 to $301.63.
Investor concerns intensify as lawsuits follow AI product delays and misses
AppLovin Corporation has come under increased scrutiny after multiple securities class action lawsuits were filed, alleging that the company and several senior executives misrepresented both the capabilities and the development timeline of its AI-powered advertising products between February 12 and August 5, 2026. These legal challenges, according to the referenced complaints, directly elevated regulatory and operational risk for the company, intensifying negative sentiment. The company further acknowledged delays in its generative AI video creative feature and disclosed Q2 2026 revenue of $1.92 billion—falling short of consensus estimates—while its AI video tool remained under development. Ongoing legal proceedings, product delays, and soft revenue have compounded investor concerns, while multiple law firms have noted a lead plaintiff deadline for the securities case.
Oversold readings deepen amid dominance by sellers, with trend weakly established
On the hourly chart, APP is trading below the MA-20 at $308.74, the MA-50 at $315.36, and also under the MA-200 at $462.33. The Ichimoku Kijun line now stands at $308.47 and is acting as immediate resistance. Momentum remains negative, with MACD and RSI both in sell territory, while ADX is neutral, indicating the trend is not strongly established. The RSI, Stochastic RSI, CCI, and Bull/Bear Power all signal oversold conditions and dominance by sellers. Awesome Oscillator readings also align with the current downtrend, and intraday trading continues with high volatility and price action near the low of the session.
Sideways action likely as downside risk persists and rebound odds diminish
For the next two to three trading days, APP is expected to consolidate between $285.15 and $301.63. Downside risk is elevated, and the probability of a rebound is considered very low, which favors the likelihood of a continued retreat if support at $285.15 fails. The baseline expectation is sideways movement within this volatility band, while any bullish scenario would require a clear and sustained break above $308.47 to shift momentum.
Earlier, analysts noted that AppLovin faced persistent technical pressure and heightened legal scrutiny, with risks skewed to the downside. The latest developments—marked by ongoing lawsuits, disappointing revenue, and fresh technical breakdowns—reinforce the prevailing bearish scenario, making a sustained move below $285.15 a key downside risk for traders to monitor.






Latest AppLovin News





-
 Afghanistan
-
 Albania
-
 Algeria
-
 Angola
-
 Argentina
-
 Armenia
-
 Australia
-
 Austria
-
 Azerbaijan
-
 Bahamas
-
 Bahrain
-
 Bangladesh
-
 Belarus
-
 Belgium
-
 Bolivia
-
 Botswana
-
 Brazil
-
 Brunei
-
 Bulgaria
-
 Cambodia
-
 Cameroon
-
 Canada
-
 Chile
-
 China
-
 Colombia
-
 Congo
-
 Costa Rica
-
 Cote d'Ivoire
-
 Croatia
-
 Cuba
-
 Cyprus
-
 Czechia
-
 DR Congo
-
 Denmark
-
 Dominican Republic
-
 Ecuador
-
 Egypt
-
 El Salvador
-
 Estonia
-
 Eswatini
-
 Ethiopia
-
 Finland
-
 France
-
 Georgia
-
 Germany
-
 Ghana
-
 Greece
-
 Haiti
-
 Hong Kong
-
 Hungary
-
 India
-
 Indonesia
-
 Iran, Islamic republic
-
 Iraq
-
 Ireland
-
 Israel
-
 Italy
-
 Jamaica
-
 Japan
-
 Jordan
-
 Kazakhstan
-
 Kenya
-
 Korea
-
 Kuwait
-
 Kyrgyzstan
-
 Laos
-
 Latvia
-
 Lebanon
-
 Lesotho
-
 Libya
-
 Lithuania
-
 Luxembourg
-
 Madagascar
-
 Malaysia
-
 Malta
-
 Mauritius
-
 Mexico
-
 Moldova
-
 Mongolia
-
 Montenegro
-
 Morocco
-
 Mozambique
-
 Myanmar
-
 Namibia
-
 Nepal
-
 Netherlands
-
 New Zealand
-
 Nigeria
-
 North Macedonia
-
 Norway
-
 Oman
-
 Pakistan
-
 Palestine
-
 Panama
-
 Papua New Guinea
-
 Paraguay
-
 Peru
-
 Philippines
-
 Poland
-
 Portugal
-
 Puerto Rico
-
 Qatar
-
 Reunion
-
 Romania
-
 Rwanda
-
 Saudi Arabia
-
 Serbia
-
 Singapore
-
 Slovakia
-
 Slovenia
-
 Somalia
-
 South Africa
-
 Spain
-
 Sri Lanka
-
 Sweden
-
 Switzerland
-
 Syria
-
 Taiwan
-
 Tajikistan
-
 Tanzania
-
 Thailand
-
 Trinidad and Tobago
-
 Tunisia
-
 Turkey
-
 UAE
-
 Uganda
-
 Ukraine
-
 United Kingdom
-
United States
-
 Uruguay
-
 Uzbekistan
-
 Venezuela
-
 Vietnam
-
 Yemen
-
 Zambia
-
 Zimbabwe
- Forex
- Crypto












