

Arm stock trades near $269.08 support as sellers dominate short-term trend

Arm (ARM) stock is trading at $289.66, down 1.37% on the day. The price is currently positioned below its short- and medium-term moving averages but remains above its longer-term average.
 170.65
191.65
Highlights
- Arm Holdings generates stable and recurring income from licensing fees and royalties on chip designs used in over 99% of smartphones.
- The company’s technology has been embedded in more than 350 billion chips, establishing a broad and durable industry footprint.
- Shares of Arm trade below key short- and medium-term moving averages with strong sell momentum, and the next expected price range is $269.08 to $310.24.
Stable revenue underpins outlook as price faces industry pressure
Arm Holdings generates its revenue through licensing fees and royalties from its chip designs, a business model that provides a stable and recurring stream of income, according to Fool. The company's technology is implemented in more than 99% of the global smartphone market and has been embedded in over 350 billion chips to date, reflecting its expansive reach across the semiconductor industry. This substantial installed base underpins long-term revenue visibility though price action has remained under broader selling pressure.
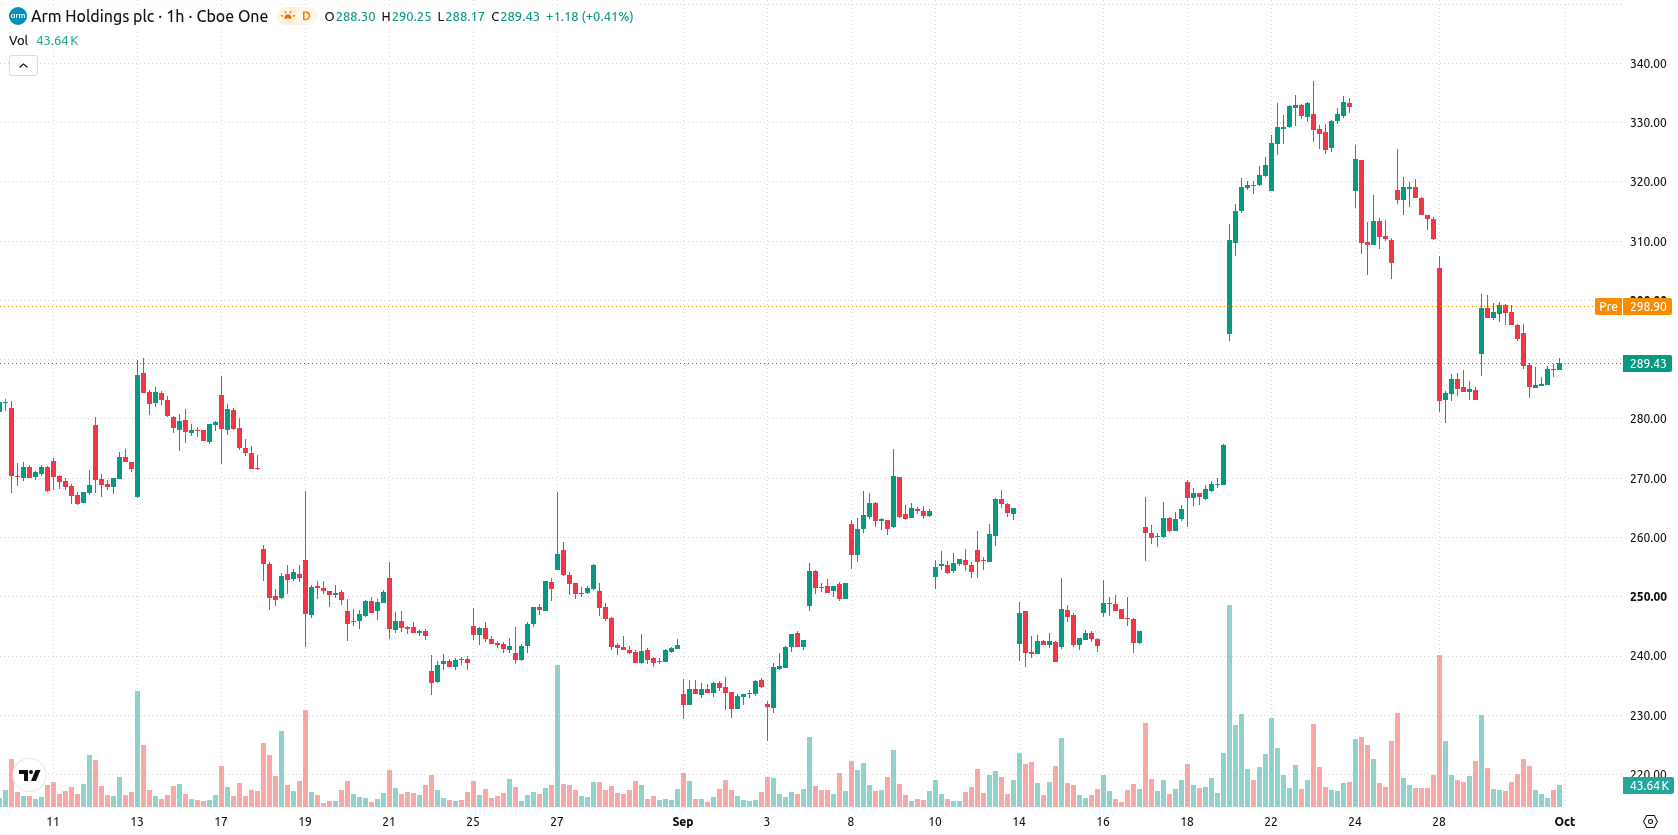
Bearish momentum builds as near-term resistance limits gains
On the technical side, ARM is trading below both the MA-20 and MA-50 on the hourly chart, pointing to near-term resistance, while the daily chart shows price above the MA-200, which remains a key support. The Ichimoku Kijun at $299.78 presents immediate overhead resistance. Momentum indicators show a bearish structure: both MACD and ADX indicate a strong intraday sell bias. RSI stands at 42.14 and Stochastic RSI is in oversold territory, highlighting selling pressure, while CCI and the Awesome Oscillator are currently neutral. Bull/Bear Power signals sellers in control of momentum.
Sideways consolidation forecast as breakout risks remain balanced
Looking ahead, the expected price range for ARM over the next sessions is $269.08 to $310.24, representing a typical volatility band relative to current levels. There is a 58% probability of a downward move, while the chance of a bounce higher stands at 42%. The baseline view is for ARM to consolidate in a sideways corridor near current prices. A bullish breakout above the $299.78 resistance could lead to a test of the upper bound, while a drop below $269.08 would likely trigger further downside pressure.
Earlier, analysts noted that Arm Holdings was facing continued selling pressure despite ongoing growth in revenue and technology adoption. The current analysis reinforces this cautious stance, with technical signals now emphasizing a risk of further near-term downside if support at the MA-200 gives way.










-
 Afghanistan
-
 Albania
-
 Algeria
-
 Angola
-
 Argentina
-
 Armenia
-
 Australia
-
 Austria
-
 Azerbaijan
-
 Bahamas
-
 Bahrain
-
 Bangladesh
-
 Belarus
-
 Belgium
-
 Bolivia
-
 Botswana
-
 Brazil
-
 Brunei
-
 Bulgaria
-
 Cambodia
-
 Cameroon
-
 Canada
-
 Chile
-
 China
-
 Colombia
-
 Congo
-
 Costa Rica
-
 Cote d'Ivoire
-
 Croatia
-
 Cuba
-
 Cyprus
-
 Czechia
-
 DR Congo
-
 Denmark
-
 Dominican Republic
-
 Ecuador
-
 Egypt
-
 El Salvador
-
 Estonia
-
 Eswatini
-
 Ethiopia
-
 Finland
-
 France
-
 Georgia
-
 Germany
-
 Ghana
-
 Greece
-
 Haiti
-
 Hong Kong
-
 Hungary
-
 India
-
 Indonesia
-
 Iran, Islamic republic
-
 Iraq
-
 Ireland
-
 Israel
-
 Italy
-
 Jamaica
-
 Japan
-
 Jordan
-
 Kazakhstan
-
 Kenya
-
 Korea
-
 Kuwait
-
 Kyrgyzstan
-
 Laos
-
 Latvia
-
 Lebanon
-
 Lesotho
-
 Libya
-
 Lithuania
-
 Luxembourg
-
 Madagascar
-
 Malaysia
-
 Malta
-
 Mauritius
-
 Mexico
-
 Moldova
-
 Mongolia
-
 Montenegro
-
 Morocco
-
 Mozambique
-
 Myanmar
-
 Namibia
-
 Nepal
-
 Netherlands
-
 New Zealand
-
 Nigeria
-
 North Macedonia
-
 Norway
-
 Oman
-
 Pakistan
-
 Palestine
-
 Panama
-
 Papua New Guinea
-
 Paraguay
-
 Peru
-
 Philippines
-
 Poland
-
 Portugal
-
 Puerto Rico
-
 Qatar
-
 Reunion
-
 Romania
-
 Rwanda
-
 Saudi Arabia
-
 Serbia
-
 Singapore
-
 Slovakia
-
 Slovenia
-
 Somalia
-
 South Africa
-
 Spain
-
 Sri Lanka
-
 Sweden
-
 Switzerland
-
 Syria
-
 Taiwan
-
 Tajikistan
-
 Tanzania
-
 Thailand
-
 Trinidad and Tobago
-
 Tunisia
-
 Turkey
-
 UAE
-
 Uganda
-
 Ukraine
-
 United Kingdom
-
United States
-
 Uruguay
-
 Uzbekistan
-
 Venezuela
-
 Vietnam
-
 Yemen
-
 Zambia
-
 Zimbabwe
- Forex
- Crypto












