

ASTS consolidates as three BlueBird satellites shipped to Cape Canaveral

AST SpaceMobile (ASTS) stock is trading at $58.86 after a slight daily decline. The price remains below its key moving averages, reflecting ongoing short-term weakness.
 42.36
44.82
Highlights
- AST SpaceMobile shipped three BlueBird satellites to Cape Canaveral, strengthening efforts to scale its direct-to-phone satellite network.
- The company reported a contracted revenue backlog of about $1.3 billion and growing engagements with the U.S. Space Development Agency.
- Shares of AST SpaceMobile show strong bearish momentum, trading below key moving averages with technicals confirming high probability of further downside within the $55.79 to $61.93 range.
Network expansion and acquisition speculation drive operational outlook
AST SpaceMobile has shipped three additional BlueBird satellites (14-16) to Cape Canaveral, marking a further step in the company's effort to scale its direct-to-phone satellite network, according to Seekingalpha. This tangible progress in expanding network capacity strengthens its underlying operational platform and could support future service rollout. In addition, AST SpaceMobile recently adopted a Senior Management Change of Control Severance Policy that has contributed to market chatter about a possible acquisition, though there is no confirmation of any deal, and reported a contracted revenue backlog of approximately $1.3 billion with expanding engagements by the U.S. Space Development Agency, as noted by Tradingview.
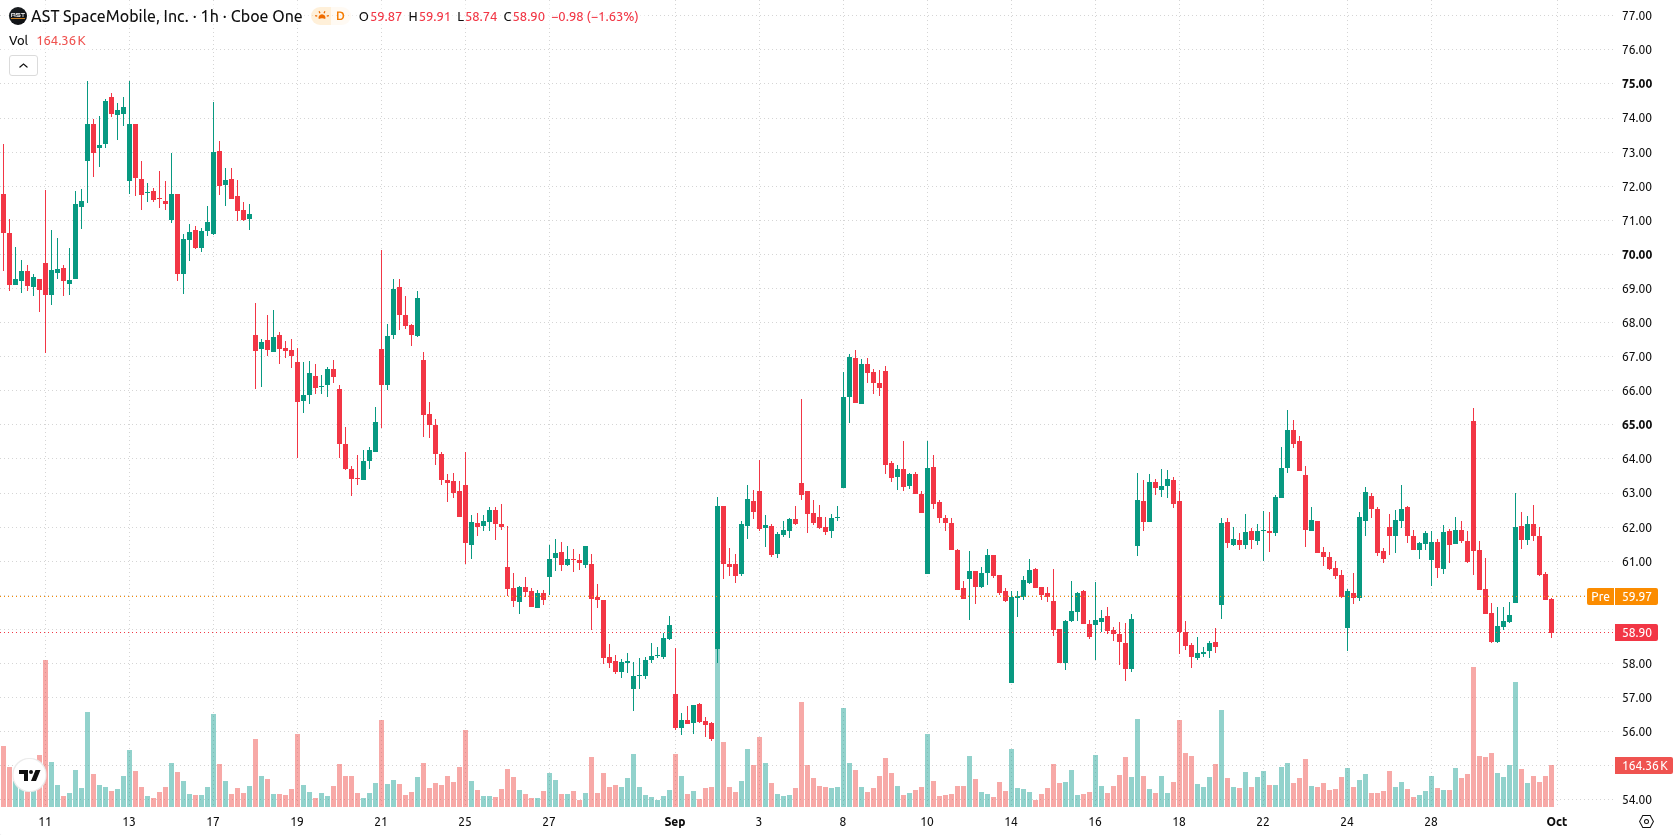
Downtrend affirmed as momentum and indicators flash oversold
ASTS/USD trades below MA-20 at $60.67 and MA-50 at $61.42 on the hourly chart, with price also remaining under the long-term MA-200 at $81.24. The Ichimoku Kijun, currently at $61.94, is acting as immediate resistance. Momentum readings show weak conditions, as the MACD indicates a Sell mode, ADX is Neutral, and RSI registers at 38.72, aligning with a Sell signal. Both the Stoch RSI and CCI are Oversold, highlighting stretched downside conditions, while Bull/Bear Power is deeply Oversold, pointing to dominant intraday selling pressure. The Awesome Oscillator signals a Strong Sell, reinforcing a prevailing downtrend.
Rangebound trading likely as breakout risk remains minimal
In the short term, ASTS is expected to consolidate within the $55.79–$61.93 range, reflecting its current volatility band relative to recent trading behavior. The probability of an upward breakout is considered very low, with strong likelihood for continued downside should support at $55.79 fail. A bullish reversal scenario would first require a clear breakout above resistance at $61.94. The baseline expectation is for prices to remain rangebound unless the lower band is breached, which could expose further near-term declines.
Earlier, analysts noted that AST SpaceMobile was contending with unresolved momentum challenges and heightened acquisition speculation due to structural and management developments. With the stock firmly below key moving averages and downside risks prevailing, traders should closely monitor the $55.79 support level as a potential inflection point for near-term price action.









-
 Afghanistan
-
 Albania
-
 Algeria
-
 Angola
-
 Argentina
-
 Armenia
-
 Australia
-
 Austria
-
 Azerbaijan
-
 Bahamas
-
 Bahrain
-
 Bangladesh
-
 Belarus
-
 Belgium
-
 Bolivia
-
 Botswana
-
 Brazil
-
 Brunei
-
 Bulgaria
-
 Cambodia
-
 Cameroon
-
 Canada
-
 Chile
-
 China
-
 Colombia
-
 Congo
-
 Costa Rica
-
 Cote d'Ivoire
-
 Croatia
-
 Cuba
-
 Cyprus
-
 Czechia
-
 DR Congo
-
 Denmark
-
 Dominican Republic
-
 Ecuador
-
 Egypt
-
 El Salvador
-
 Estonia
-
 Eswatini
-
 Ethiopia
-
 Finland
-
 France
-
 Georgia
-
 Germany
-
 Ghana
-
 Greece
-
 Haiti
-
 Hong Kong
-
 Hungary
-
 India
-
 Indonesia
-
 Iran, Islamic republic
-
 Iraq
-
 Ireland
-
 Israel
-
 Italy
-
 Jamaica
-
 Japan
-
 Jordan
-
 Kazakhstan
-
 Kenya
-
 Korea
-
 Kuwait
-
 Kyrgyzstan
-
 Laos
-
 Latvia
-
 Lebanon
-
 Lesotho
-
 Libya
-
 Lithuania
-
 Luxembourg
-
 Madagascar
-
 Malaysia
-
 Malta
-
 Mauritius
-
 Mexico
-
 Moldova
-
 Mongolia
-
 Montenegro
-
 Morocco
-
 Mozambique
-
 Myanmar
-
 Namibia
-
 Nepal
-
 Netherlands
-
 New Zealand
-
 Nigeria
-
 North Macedonia
-
 Norway
-
 Oman
-
 Pakistan
-
 Palestine
-
 Panama
-
 Papua New Guinea
-
 Paraguay
-
 Peru
-
 Philippines
-
 Poland
-
 Portugal
-
 Puerto Rico
-
 Qatar
-
 Reunion
-
 Romania
-
 Rwanda
-
 Saudi Arabia
-
 Serbia
-
 Singapore
-
 Slovakia
-
 Slovenia
-
 Somalia
-
 South Africa
-
 Spain
-
 Sri Lanka
-
 Sweden
-
 Switzerland
-
 Syria
-
 Taiwan
-
 Tajikistan
-
 Tanzania
-
 Thailand
-
 Trinidad and Tobago
-
 Tunisia
-
 Turkey
-
 UAE
-
 Uganda
-
 Ukraine
-
 United Kingdom
-
United States
-
 Uruguay
-
 Uzbekistan
-
 Venezuela
-
 Vietnam
-
 Yemen
-
 Zambia
-
 Zimbabwe
- Forex
- Crypto












