

Will BT Group stock avoid deeper losses as sellers dominate the short-term trend?

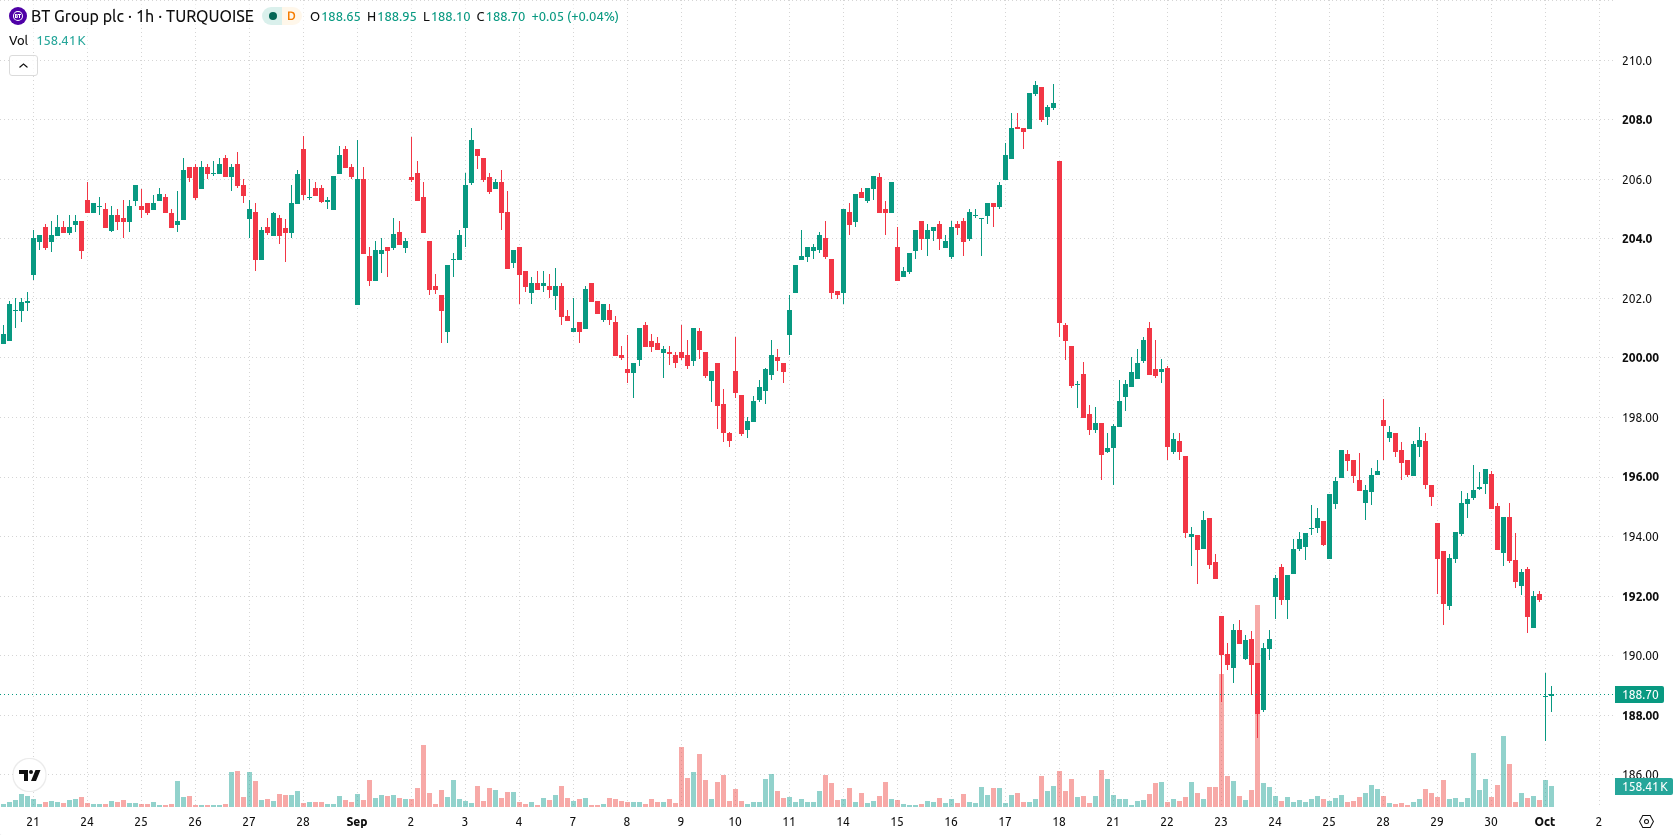
BT Group (BT-A) stock is trading at GBX192, finishing the session down 2.04% and ending close to the day’s low. The stock is positioned below its key moving averages, reflecting broad-based selling pressure.
 215.20
Highlights
- BT-A/GBX stock closed at GBX192, falling 2.04% and ending near the session low with high volatility.
- Shares traded below key short, medium, and long-term moving averages as technical momentum and trend strength remained weak.
- The anticipated range for the next few trading days is GBX188.39 to GBX195.61, with a 77% probability for further downside.
Technical exhaustion as BT-A faces entrenched resistance and bearish momentum
BT-A/GBX is trading below the MA-20 (GBX193.91), MA-50 (GBX194.24), and MA-200 (GBX202.43), with the Ichimoku Kijun at GBX194.32 acting as immediate resistance. MACD continues to show a Sell signal, while ADX reflects neutral trend strength. Momentum indicators, including RSI at 40.16, Stoch RSI, CCI, and Bull/Bear Power, are oversold or negative, supporting the presence of sellers intraday. The Awesome Oscillator aligns with the downward price traction.
Downside scenario favored as volatility shapes short-term trading range
In the near term, BT-A is expected to trade within a GBX188.39 to GBX195.61 range, with volatility likely to persist. The probability of an upward move remains low at 23%, while a downward scenario is more probable at 77%. The baseline outlook is for the price to stay within this volatility band; a break above immediate resistance could trigger a bullish move, whereas a drop below the lower end of the corridor would reinforce the bearish outcome.
Earlier, analysts noted that persistent macroeconomic and geopolitical pressures continued to weigh on BT Group, keeping sellers in control. The current technical outlook confirms ongoing downside risk, with traders advised to watch for a decisive move outside the GBX188.39–195.61 volatility band as the next signal for a directional shift.






Latest BT Group News




-
 Afghanistan
-
 Albania
-
 Algeria
-
 Angola
-
 Argentina
-
 Armenia
-
 Australia
-
 Austria
-
 Azerbaijan
-
 Bahamas
-
 Bahrain
-
 Bangladesh
-
 Belarus
-
 Belgium
-
 Bolivia
-
 Botswana
-
 Brazil
-
 Brunei
-
 Bulgaria
-
 Cambodia
-
 Cameroon
-
 Canada
-
 Chile
-
 China
-
 Colombia
-
 Congo
-
 Costa Rica
-
 Cote d'Ivoire
-
 Croatia
-
 Cuba
-
 Cyprus
-
 Czechia
-
 DR Congo
-
 Denmark
-
 Dominican Republic
-
 Ecuador
-
 Egypt
-
 El Salvador
-
 Estonia
-
 Eswatini
-
 Ethiopia
-
 Finland
-
 France
-
 Georgia
-
 Germany
-
 Ghana
-
 Greece
-
 Haiti
-
 Hong Kong
-
 Hungary
-
 India
-
 Indonesia
-
 Iran, Islamic republic
-
 Iraq
-
 Ireland
-
 Israel
-
 Italy
-
 Jamaica
-
 Japan
-
 Jordan
-
 Kazakhstan
-
 Kenya
-
 Korea
-
 Kuwait
-
 Kyrgyzstan
-
 Laos
-
 Latvia
-
 Lebanon
-
 Lesotho
-
 Libya
-
 Lithuania
-
 Luxembourg
-
 Madagascar
-
 Malaysia
-
 Malta
-
 Mauritius
-
 Mexico
-
 Moldova
-
 Mongolia
-
 Montenegro
-
 Morocco
-
 Mozambique
-
 Myanmar
-
 Namibia
-
 Nepal
-
 Netherlands
-
 New Zealand
-
 Nigeria
-
 North Macedonia
-
 Norway
-
 Oman
-
 Pakistan
-
 Palestine
-
 Panama
-
 Papua New Guinea
-
 Paraguay
-
 Peru
-
 Philippines
-
 Poland
-
 Portugal
-
 Puerto Rico
-
 Qatar
-
 Reunion
-
 Romania
-
 Rwanda
-
 Saudi Arabia
-
 Serbia
-
 Singapore
-
 Slovakia
-
 Slovenia
-
 Somalia
-
 South Africa
-
 Spain
-
 Sri Lanka
-
 Sweden
-
 Switzerland
-
 Syria
-
 Taiwan
-
 Tajikistan
-
 Tanzania
-
 Thailand
-
 Trinidad and Tobago
-
 Tunisia
-
 Turkey
-
 UAE
-
 Uganda
-
 Ukraine
-
 United Kingdom
-
United States
-
 Uruguay
-
 Uzbekistan
-
 Venezuela
-
 Vietnam
-
 Yemen
-
 Zambia
-
 Zimbabwe
- Forex
- Crypto












