

AST SpaceMobile shares technical analysis: $53.3 support under pressure

AST SpaceMobile (ASTS) stock is trading at $57.04, down 3.22% for the day. The price currently sits below its key moving averages, reflecting ongoing downside momentum relative to recent benchmarks.
 42.36
44.85
Highlights
- AST SpaceMobile shipped three additional BlueBird satellites to Cape Canaveral, increasing its ready-to-deploy fleet to 13 active satellites.
- The company adopted a new Senior Management Change of Control Severance Policy and appointed Wayne Thorsen as chief commercial officer, signaling changes in commercial leadership.
- Shares of AST SpaceMobile trade below key moving averages with strong intraday selling and high volatility, with price expected to remain in a $53.3 to $60.78 range.
Satellite expansion and management changes drive strategic transition
AST SpaceMobile recently shipped three additional BlueBird satellites (units 14, 15, and 16) from its Midland, Texas facility to Cape Canaveral, expanding its deployment pipeline and boosting its operational readiness. The company's active orbital fleet stands at 13 satellites following the August deployment, reflecting ongoing execution of its rollout, while a new Senior Management Change of Control Severance Policy was adopted on September 25. In addition, Wayne Thorsen has assumed the role of executive vice president and chief commercial officer, according to Stocktwits, contributing to leadership transitions in the commercial strategy.
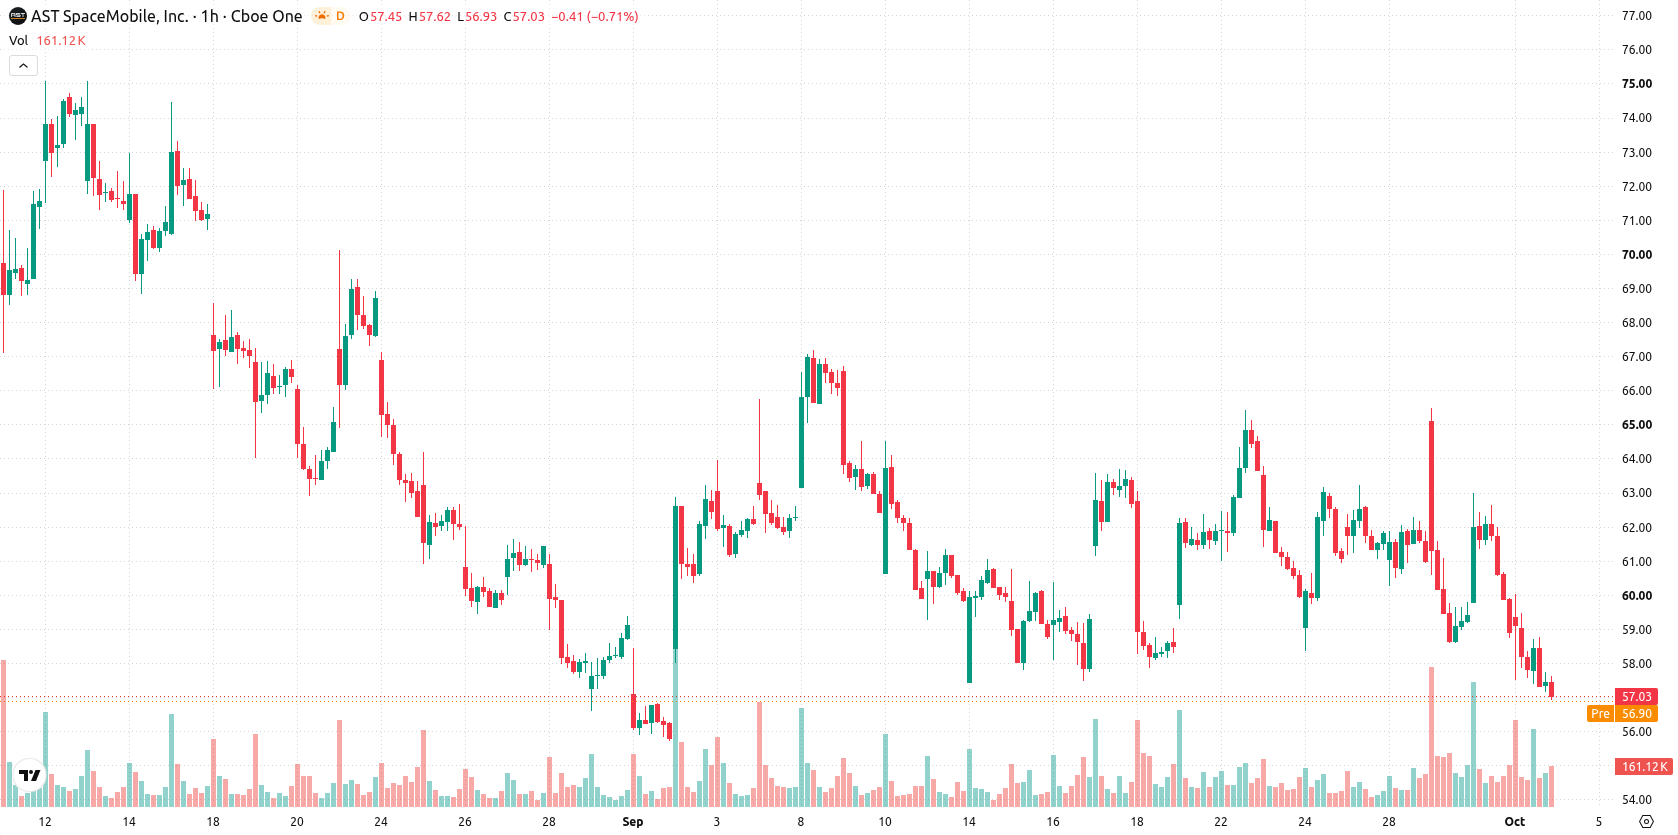
Seller dominance reinforced as ASTS breaches technical support levels
On the technical front, ASTS is trading below its MA-20 ($59.41) and MA-50 ($60.69) on the hourly chart and remains well under the long-term MA-200 ($81.14) on the daily timeframe. The Ichimoku Kijun sits overhead at $61.12, providing immediate resistance. MACD signals a Sell, with ADX remaining Neutral, while RSI (34.16), Stochastic RSI, CCI, and Bull/Bear Power all point to intraday oversold conditions or strong seller dominance. The Awesome Oscillator adds confluence to the existing downward momentum, and price behavior near the daily low at $57.04 and a recent gap-up at the open underscores heightened volatility and downside pressure.
Low reversal odds as trading range narrows and risks intensify
In the short term, ASTS is expected to trade within a $53.3–$60.78 volatility band relative to current levels. The likelihood of a bullish reversal is low, with near-term trading favoring further consolidation or downside extension. Should the price climb above the $61.12 resistance, a more constructive scenario could emerge, but any sustained drop below $53.3 would likely accelerate recent losses and deepen the prevailing downtrend.
Earlier, analysts noted that AST SpaceMobile was contending with persistent downside momentum and heightened speculation surrounding management and potential acquisition activity. The current technical setup further reinforces the prevailing downtrend, making sustained price action above the $61.12 resistance a critical threshold for any potential stabilization or reversal.









-
 Afghanistan
-
 Albania
-
 Algeria
-
 Angola
-
 Argentina
-
 Armenia
-
 Australia
-
 Austria
-
 Azerbaijan
-
 Bahamas
-
 Bahrain
-
 Bangladesh
-
 Belarus
-
 Belgium
-
 Bolivia
-
 Botswana
-
 Brazil
-
 Brunei
-
 Bulgaria
-
 Cambodia
-
 Cameroon
-
 Canada
-
 Chile
-
 China
-
 Colombia
-
 Congo
-
 Costa Rica
-
 Cote d'Ivoire
-
 Croatia
-
 Cuba
-
 Cyprus
-
 Czechia
-
 DR Congo
-
 Denmark
-
 Dominican Republic
-
 Ecuador
-
 Egypt
-
 El Salvador
-
 Estonia
-
 Eswatini
-
 Ethiopia
-
 Finland
-
 France
-
 Georgia
-
 Germany
-
 Ghana
-
 Greece
-
 Haiti
-
 Hong Kong
-
 Hungary
-
 India
-
 Indonesia
-
 Iran, Islamic republic
-
 Iraq
-
 Ireland
-
 Israel
-
 Italy
-
 Jamaica
-
 Japan
-
 Jordan
-
 Kazakhstan
-
 Kenya
-
 Korea
-
 Kuwait
-
 Kyrgyzstan
-
 Laos
-
 Latvia
-
 Lebanon
-
 Lesotho
-
 Libya
-
 Lithuania
-
 Luxembourg
-
 Madagascar
-
 Malaysia
-
 Malta
-
 Mauritius
-
 Mexico
-
 Moldova
-
 Mongolia
-
 Montenegro
-
 Morocco
-
 Mozambique
-
 Myanmar
-
 Namibia
-
 Nepal
-
 Netherlands
-
 New Zealand
-
 Nigeria
-
 North Macedonia
-
 Norway
-
 Oman
-
 Pakistan
-
 Palestine
-
 Panama
-
 Papua New Guinea
-
 Paraguay
-
 Peru
-
 Philippines
-
 Poland
-
 Portugal
-
 Puerto Rico
-
 Qatar
-
 Reunion
-
 Romania
-
 Rwanda
-
 Saudi Arabia
-
 Serbia
-
 Singapore
-
 Slovakia
-
 Slovenia
-
 Somalia
-
 South Africa
-
 Spain
-
 Sri Lanka
-
 Sweden
-
 Switzerland
-
 Syria
-
 Taiwan
-
 Tajikistan
-
 Tanzania
-
 Thailand
-
 Trinidad and Tobago
-
 Tunisia
-
 Turkey
-
 UAE
-
 Uganda
-
 Ukraine
-
 United Kingdom
-
United States
-
 Uruguay
-
 Uzbekistan
-
 Venezuela
-
 Vietnam
-
 Yemen
-
 Zambia
-
 Zimbabwe
- Forex
- Crypto












