

Quarterly dividend raised to $1.52 per share: Can Texas Instruments stock break $298 resistance?

Texas Instruments (TXN) stock is trading at $293.38 after a daily gain of 4.29%. The price sits above its key moving averages, strengthening its short- and medium-term technical positioning.
 309.95
Highlights
- Texas Instruments raised its quarterly dividend by 7% to $1.52 per share, increasing direct shareholder payouts.
- Industrial segment revenues grew about 30% year over year and automotive revenues rose in the mid-teens in Q2 2026.
- Shares of Texas Instruments rose 4.29% to $293.38, with technical signals strong and a projected range of $280.65 to $298.
Dividend hike and revenue growth bolster investor enthusiasm
Texas Instruments has approved a 7% increase in its quarterly dividend to $1.52 per share, directly enhancing shareholder returns and signaling management confidence in its cash flow profile. This move is complemented by strong operating results, as industrial revenues surged by roughly 30% year over year and automotive revenues grew in the mid-teens during Q2 2026, according to Tradingview. Additionally, Texas Instruments upgraded its membership in the Zephyr Project to Platinum, as reported by PR Newswire, supporting the company's presence in the open source RTOS ecosystem. These developments collectively provide a robust backdrop for renewed investor demand.
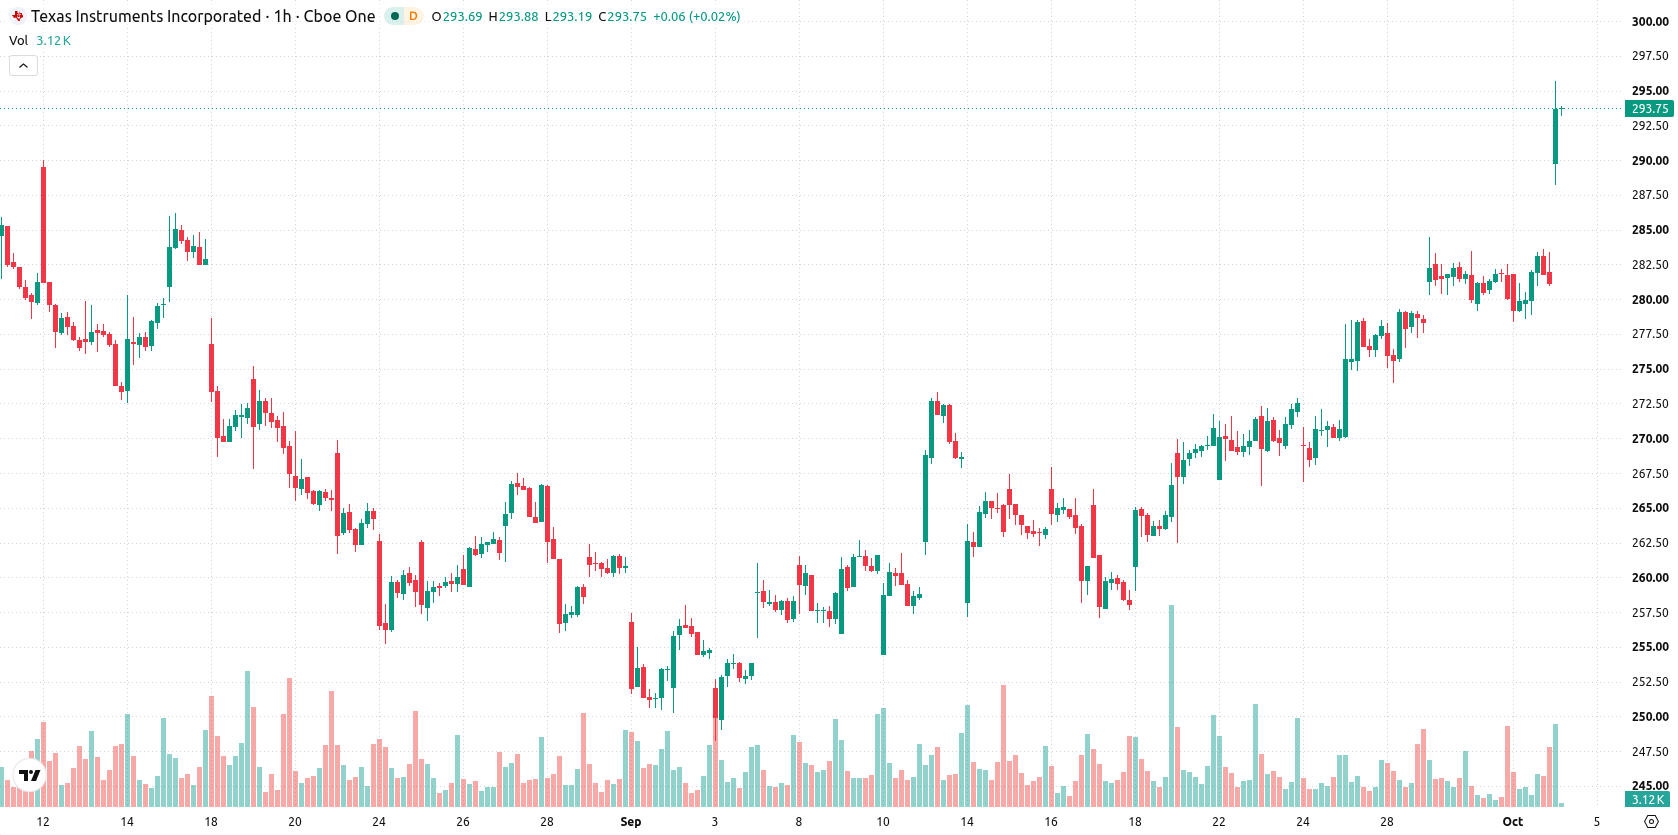
Technical breakout and momentum indicators hint at buyer dominance
On the technical front, TXN has cleared the MA-20 at $281.23 and the MA-50 at $276.96 on the hourly chart, and remains well above the MA-200 at $248.22 on the daily timeframe. The Ichimoku Kijun at $279.93 provides immediate support. Momentum readings show MACD at Strong Buy and ADX at Buy, while RSI stands at 55.5 and CCI also signals Buy. Stochastic RSI is Neutral, and Bull/Bear Power is in Overbought territory, indicating dominant buyer pressure but some risk of a short-term pullback. The Awesome Oscillator supports the ongoing upward trend.
Upside probability dominates as trading range narrows
In the short term, TXN is expected to trade within the $280.65–$298 range. The probability of further upside is very high, while downside risk appears limited for now. The baseline scenario calls for sideways movement within this band, but a bullish breakout above $298 could open the door to new highs. A sustained decline below $280.65 support would be required for a bearish reversal.
Earlier, analysts noted that anticipating major turning points in semiconductor stocks requires attention to both long-cycle indicators and structural industry shifts. The current outlook for Texas Instruments aligns with this approach, underlining $298 as the next technical level to monitor for a potential breakout.






Latest Texas Instruments News




-
 Afghanistan
-
 Albania
-
 Algeria
-
 Angola
-
 Argentina
-
 Armenia
-
 Australia
-
 Austria
-
 Azerbaijan
-
 Bahamas
-
 Bahrain
-
 Bangladesh
-
 Belarus
-
 Belgium
-
 Bolivia
-
 Botswana
-
 Brazil
-
 Brunei
-
 Bulgaria
-
 Cambodia
-
 Cameroon
-
 Canada
-
 Chile
-
 China
-
 Colombia
-
 Congo
-
 Costa Rica
-
 Cote d'Ivoire
-
 Croatia
-
 Cuba
-
 Cyprus
-
 Czechia
-
 DR Congo
-
 Denmark
-
 Dominican Republic
-
 Ecuador
-
 Egypt
-
 El Salvador
-
 Estonia
-
 Eswatini
-
 Ethiopia
-
 Finland
-
 France
-
 Georgia
-
 Germany
-
 Ghana
-
 Greece
-
 Haiti
-
 Hong Kong
-
 Hungary
-
 India
-
 Indonesia
-
 Iran, Islamic republic
-
 Iraq
-
 Ireland
-
 Israel
-
 Italy
-
 Jamaica
-
 Japan
-
 Jordan
-
 Kazakhstan
-
 Kenya
-
 Korea
-
 Kuwait
-
 Kyrgyzstan
-
 Laos
-
 Latvia
-
 Lebanon
-
 Lesotho
-
 Libya
-
 Lithuania
-
 Luxembourg
-
 Madagascar
-
 Malaysia
-
 Malta
-
 Mauritius
-
 Mexico
-
 Moldova
-
 Mongolia
-
 Montenegro
-
 Morocco
-
 Mozambique
-
 Myanmar
-
 Namibia
-
 Nepal
-
 Netherlands
-
 New Zealand
-
 Nigeria
-
 North Macedonia
-
 Norway
-
 Oman
-
 Pakistan
-
 Palestine
-
 Panama
-
 Papua New Guinea
-
 Paraguay
-
 Peru
-
 Philippines
-
 Poland
-
 Portugal
-
 Puerto Rico
-
 Qatar
-
 Reunion
-
 Romania
-
 Rwanda
-
 Saudi Arabia
-
 Serbia
-
 Singapore
-
 Slovakia
-
 Slovenia
-
 Somalia
-
 South Africa
-
 Spain
-
 Sri Lanka
-
 Sweden
-
 Switzerland
-
 Syria
-
 Taiwan
-
 Tajikistan
-
 Tanzania
-
 Thailand
-
 Trinidad and Tobago
-
 Tunisia
-
 Turkey
-
 UAE
-
 Uganda
-
 Ukraine
-
 United Kingdom
-
United States
-
 Uruguay
-
 Uzbekistan
-
 Venezuela
-
 Vietnam
-
 Yemen
-
 Zambia
-
 Zimbabwe
- Forex
- Crypto












