

Oracle shares weekly forecast: Consolidation persists as price holds between key support and resistance

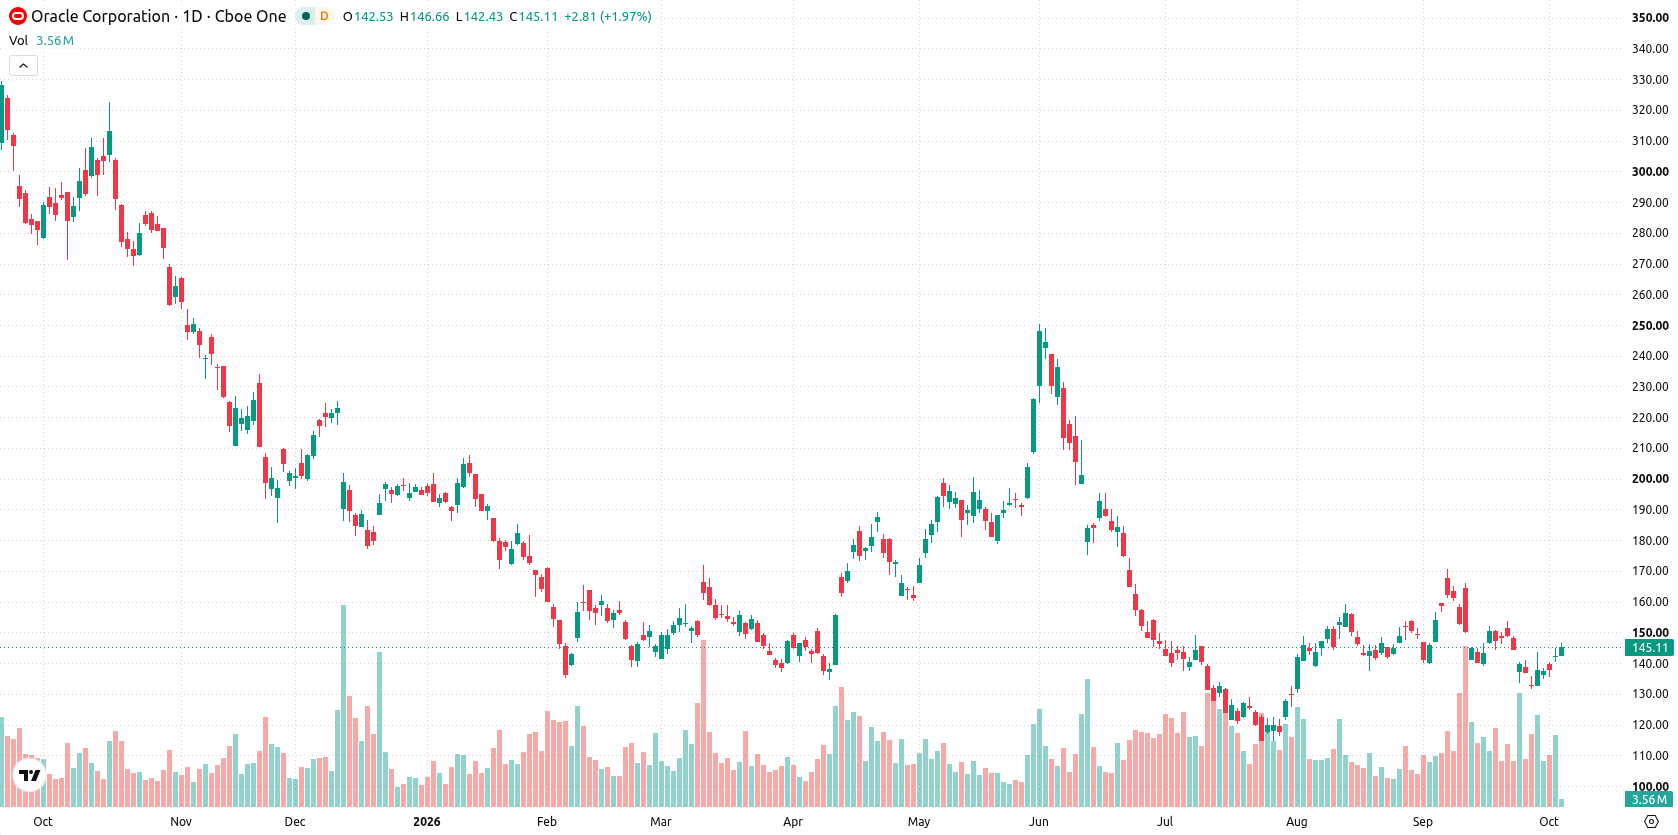
Shares of Oracle Corporation (ORCL) are trading near $146 after a gain of just over 2% last week, as buyers failed to confirm a breakout above key resistance. Momentum has paused near the recent highs, leaving the stock in consolidation mode as the new week begins.
 135.20
148.40
Highlights
- Shares of Oracle gained 2.18% over the past week to $145.53, holding near the 20-day average but well below the 200-day.
- Recent price action shows consolidation with mixed momentum signals and weekly volatility of 8.48%.
- The stock is expected to trade between $135.55 and $150.59 over the next five days, with a 74% probability of a decrease.
AI expansion and debt concerns influence sentiment as new offerings debut
Over the past week, ORCL announced new artificial intelligence applications such as Oracle Fusion Claw and enhanced compliance tools for financial institutions, according to Yahoo Finance and Simply Wall St. The company, along with its partners, introduced a range of offerings across Oracle Cloud Infrastructure and AI databases to strengthen workloads in finance and genomics. PR Newswire reported that Oracle Financial Services won 11 categories in the Chartis RiskTech100 2027 report, while outlets like 24/7 Wall St. and Seeking Alpha highlighted rising capital expenditures and increased debt tied to scaling its AI and cloud business.
Mixed momentum signals persist as price consolidates near key resistance
On the daily chart, Oracle stock has delivered a sharp move higher without a sustained trend, marked by 8.48% weekly volatility. Momentum signals are mixed: the MACD remains negative and in sell territory at -3.37, but Bull/Bear Power signals overbought conditions. Price action is squeezed between nearest support at $144.86 and resistance at $145.95 (the 20-day average), while the Ichimoku Kijun at $149.13 acts as an additional resistance. This consolidation near resistance levels suggests a pause before the next directional move.
Sideways outlook dominates as breakout risks shape the weekly forecast
Over the next five trading days, the expected range is $135.55 to $150.59, with a 26% probability of an increase and 74% probability of a decrease. The base case is sideways action within this range, anchored between support at $144.86 and resistance at $145.95. A break above $145.95 would open the path toward $149.13 and test the upper bound of the forecast range, while a move below $144.86 could see the stock slide toward the lower end near $135.55.
Earlier, analysts noted that Oracle stock showed signs of short-term strength within a consolidation phase, while cautioning that technical pressures remained unresolved. Recent price action confirms this outlook, with traders advised to monitor the $145.95 resistance and $144.86 support as key levels for the next directional move.









-
 Afghanistan
-
 Albania
-
 Algeria
-
 Angola
-
 Argentina
-
 Armenia
-
 Australia
-
 Austria
-
 Azerbaijan
-
 Bahamas
-
 Bahrain
-
 Bangladesh
-
 Belarus
-
 Belgium
-
 Bolivia
-
 Botswana
-
 Brazil
-
 Brunei
-
 Bulgaria
-
 Cambodia
-
 Cameroon
-
 Canada
-
 Chile
-
 China
-
 Colombia
-
 Congo
-
 Costa Rica
-
 Cote d'Ivoire
-
 Croatia
-
 Cuba
-
 Cyprus
-
 Czechia
-
 DR Congo
-
 Denmark
-
 Dominican Republic
-
 Ecuador
-
 Egypt
-
 El Salvador
-
 Estonia
-
 Eswatini
-
 Ethiopia
-
 Finland
-
 France
-
 Georgia
-
 Germany
-
 Ghana
-
 Greece
-
 Haiti
-
 Hong Kong
-
 Hungary
-
 India
-
 Indonesia
-
 Iran, Islamic republic
-
 Iraq
-
 Ireland
-
 Israel
-
 Italy
-
 Jamaica
-
 Japan
-
 Jordan
-
 Kazakhstan
-
 Kenya
-
 Korea
-
 Kuwait
-
 Kyrgyzstan
-
 Laos
-
 Latvia
-
 Lebanon
-
 Lesotho
-
 Libya
-
 Lithuania
-
 Luxembourg
-
 Madagascar
-
 Malaysia
-
 Malta
-
 Mauritius
-
 Mexico
-
 Moldova
-
 Mongolia
-
 Montenegro
-
 Morocco
-
 Mozambique
-
 Myanmar
-
 Namibia
-
 Nepal
-
 Netherlands
-
 New Zealand
-
 Nigeria
-
 North Macedonia
-
 Norway
-
 Oman
-
 Pakistan
-
 Palestine
-
 Panama
-
 Papua New Guinea
-
 Paraguay
-
 Peru
-
 Philippines
-
 Poland
-
 Portugal
-
 Puerto Rico
-
 Qatar
-
 Reunion
-
 Romania
-
 Rwanda
-
 Saudi Arabia
-
 Serbia
-
 Singapore
-
 Slovakia
-
 Slovenia
-
 Somalia
-
 South Africa
-
 Spain
-
 Sri Lanka
-
 Sweden
-
 Switzerland
-
 Syria
-
 Taiwan
-
 Tajikistan
-
 Tanzania
-
 Thailand
-
 Trinidad and Tobago
-
 Tunisia
-
 Turkey
-
 UAE
-
 Uganda
-
 Ukraine
-
 United Kingdom
-
United States
-
 Uruguay
-
 Uzbekistan
-
 Venezuela
-
 Vietnam
-
 Yemen
-
 Zambia
-
 Zimbabwe
- Forex
- Crypto












