

LULU slides nearly 3% as technical weakness compounds on downbeat forecast

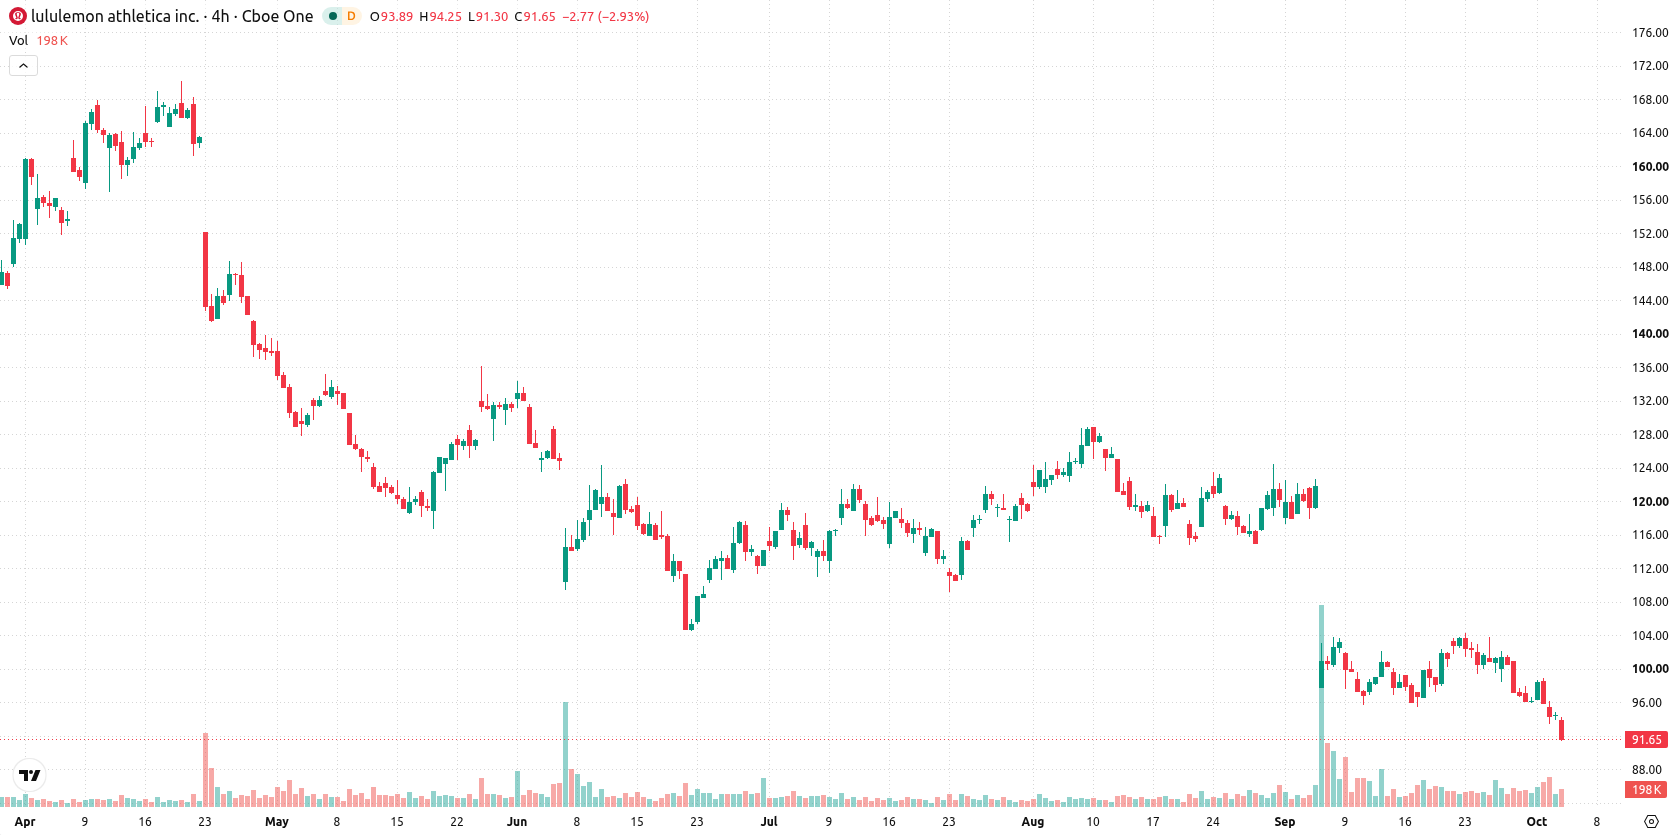
Lululemon Athletica Inc. (LULU) dropped 2.95% after the company lowered its 2026 outlook due to softer North American demand, increased tariffs, and weaker product launches. The move is supported by strong downside momentum, as the stock remains below all major moving averages and faces clear technical barriers.
 109.92
106.48
Highlights
- Lululemon stock fell after management reduced 2026 revenue and earnings guidance citing weaker North American demand, tariffs, and disappointing products.
- Shares trade at 8.54 times trailing and 10.74 times forward earnings, with 13% of shares sold short and no dividend payout.
- The stock trades below key moving averages with momentum indicators in oversold territory, forecasting a very high probability of further downside to $88.44 over the next week.
Hedge fund exposure and short positioning rise amid reduced guidance
Lululemon Athletica reduced its 2026 guidance in response to weaker North American demand, heightened tariff pressure, and lackluster recent product releases. The company also revised its revenue and earnings per share projections downward. Lululemon trades at 8.54 times trailing earnings and 10.74 times forward estimates, with 13% of shares sold short and no dividend paid. About 51 hedge funds held a combined stake of approximately $0.61 billion at the end of the second quarter of 2026.
Overlapping support breaches and oversold signals deepen bearish trend
Lululemon Athletica trades below the 20-day ($99.19), 50-day ($111.89), and 200-day ($144.94) moving averages, indicating strong downside momentum across all timeframes. The bearish alignment of the 50-day and 200-day averages confirms persistent negative sentiment. Resistance is marked at $93.65, with immediate support at $91.45. Momentum indicators such as the MACD and ADX signal strong downward pressure. The RSI, Stochastic RSI, and CCI all suggest oversold conditions, while a negative Bull/Bear Power reading and the Awesome Oscillator further highlight continued selling activity. Session volatility is elevated at 3.08%, with the price currently near session lows.
Earlier, analysts noted that Lululemon faced persistent demand headwinds, weak product launches, and ongoing downside momentum amid technical pressure. The current results reinforce that bearish thesis and, given heightened volatility, traders should monitor the $91.45 support as a potential inflection point for additional declines or stabilization.






Latest Lululemon Athletica News





-
 Afghanistan
-
 Albania
-
 Algeria
-
 Angola
-
 Argentina
-
 Armenia
-
 Australia
-
 Austria
-
 Azerbaijan
-
 Bahamas
-
 Bahrain
-
 Bangladesh
-
 Belarus
-
 Belgium
-
 Bolivia
-
 Botswana
-
 Brazil
-
 Brunei
-
 Bulgaria
-
 Cambodia
-
 Cameroon
-
 Canada
-
 Chile
-
 China
-
 Colombia
-
 Congo
-
 Costa Rica
-
 Cote d'Ivoire
-
 Croatia
-
 Cuba
-
 Cyprus
-
 Czechia
-
 DR Congo
-
 Denmark
-
 Dominican Republic
-
 Ecuador
-
 Egypt
-
 El Salvador
-
 Estonia
-
 Eswatini
-
 Ethiopia
-
 Finland
-
 France
-
 Georgia
-
 Germany
-
 Ghana
-
 Greece
-
 Haiti
-
 Hong Kong
-
 Hungary
-
 India
-
 Indonesia
-
 Iran, Islamic republic
-
 Iraq
-
 Ireland
-
 Israel
-
 Italy
-
 Jamaica
-
 Japan
-
 Jordan
-
 Kazakhstan
-
 Kenya
-
 Korea
-
 Kuwait
-
 Kyrgyzstan
-
 Laos
-
 Latvia
-
 Lebanon
-
 Lesotho
-
 Libya
-
 Lithuania
-
 Luxembourg
-
 Madagascar
-
 Malaysia
-
 Malta
-
 Mauritius
-
 Mexico
-
 Moldova
-
 Mongolia
-
 Montenegro
-
 Morocco
-
 Mozambique
-
 Myanmar
-
 Namibia
-
 Nepal
-
 Netherlands
-
 New Zealand
-
 Nigeria
-
 North Macedonia
-
 Norway
-
 Oman
-
 Pakistan
-
 Palestine
-
 Panama
-
 Papua New Guinea
-
 Paraguay
-
 Peru
-
 Philippines
-
 Poland
-
 Portugal
-
 Puerto Rico
-
 Qatar
-
 Reunion
-
 Romania
-
 Rwanda
-
 Saudi Arabia
-
 Serbia
-
 Singapore
-
 Slovakia
-
 Slovenia
-
 Somalia
-
 South Africa
-
 Spain
-
 Sri Lanka
-
 Sweden
-
 Switzerland
-
 Syria
-
 Taiwan
-
 Tajikistan
-
 Tanzania
-
 Thailand
-
 Trinidad and Tobago
-
 Tunisia
-
 Turkey
-
 UAE
-
 Uganda
-
 Ukraine
-
 United Kingdom
-
United States
-
 Uruguay
-
 Uzbekistan
-
 Venezuela
-
 Vietnam
-
 Yemen
-
 Zambia
-
 Zimbabwe
- Forex
- Crypto












