

Steel Dynamics shares technical analysis: Buyers eye $251.38 breakout level for next move

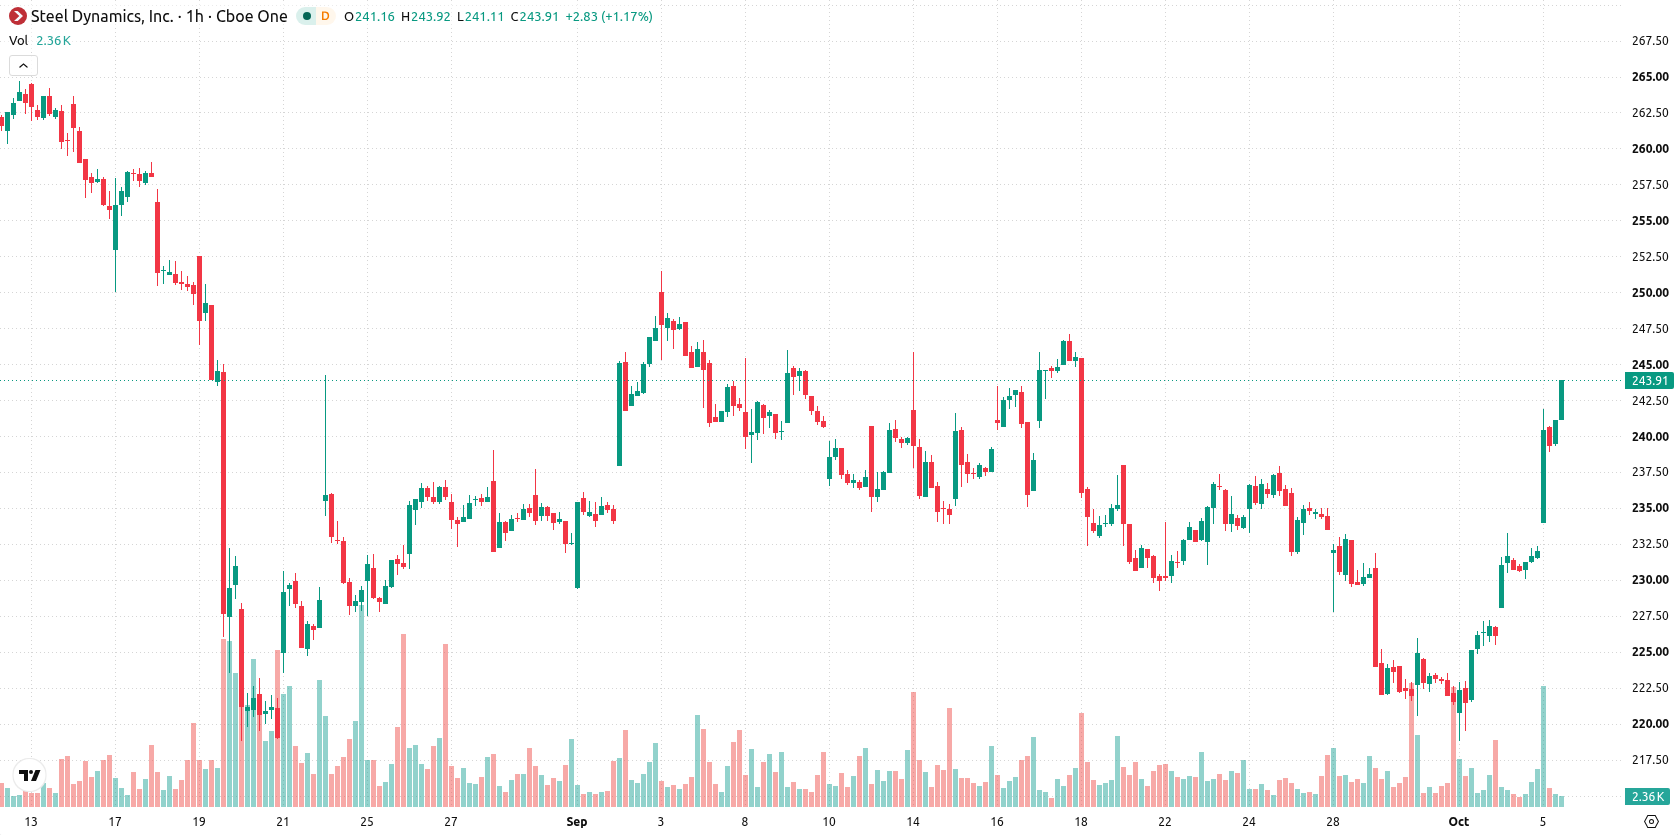
Steel Dynamics Inc. (STLD) stock is trading at $243.33, up 4.78% on the day. The price remains elevated above its key moving averages, indicating continued upside momentum during today's session.
 253.50
253.99
Highlights
- Steel Dynamics achieved a 14.87% dividend growth rate with a conservative 18.42% payout ratio, supported by recent earnings.
- Dividend expansion and disciplined distributions have attracted buyers and provided support for current stock levels.
- Steel Dynamics stock trades in a strong uptrend with a projected $237.18 to $251.38 range and 78% chance of continued upside.
Dividend growth and strong earnings drive increased buying interest
Steel Dynamics continues to exhibit robust fundamentals, with ChartMill reporting a 14.87% dividend growth rate and a conservative 18.42% payout ratio, both well-supported by solid recent earnings. This level of consistent dividend expansion enhances the stock's appeal for income-oriented investors and underscores the underlying financial strength of the company. The combination of rising earnings and disciplined distributions has contributed to increased buying interest, reinforcing support for current price levels.
Overbought signals intensify amid multiple technical supports
On the technical front, STLD/USD remains above the MA-20 and MA-50 on the hourly chart and is positioned well above the MA-200 on the daily timeframe. The Ichimoku Kijun currently sits at $230.33, establishing immediate support. Momentum indicators such as MACD and ADX confirm a buy setup, with the Awesome Oscillator also reinforcing the ongoing uptrend. Additionally, RSI, Stoch RSI, CCI, and Bull/Bear Power point to overbought conditions, highlighting dominant intraday buying pressure.
Bullish continuation favored as volatility band defines breakout risk
In the near term, the price is expected to fluctuate within the $237.18 to $251.38 volatility band relative to current levels. With a 78% probability assigned to further upside, continued bullish action remains the baseline scenario as buyers sustain momentum. Should the price push above the upper boundary, a breakout could trigger a fresh directional move; conversely, a drop below the $230.33 support would open the door to a corrective pullback.
Earlier, analysts noted that Steel Dynamics was confronting sustained downside pressure, with technical indicators reflecting a broadly bearish outlook. The current analysis marks a notable shift, highlighting a prevailing bullish scenario and suggesting that sustained movement above immediate support could extend the stock’s upside within the established volatility band.






Latest Steel Dynamics Inc News




-
 Afghanistan
-
 Albania
-
 Algeria
-
 Angola
-
 Argentina
-
 Armenia
-
 Australia
-
 Austria
-
 Azerbaijan
-
 Bahamas
-
 Bahrain
-
 Bangladesh
-
 Belarus
-
 Belgium
-
 Bolivia
-
 Botswana
-
 Brazil
-
 Brunei
-
 Bulgaria
-
 Cambodia
-
 Cameroon
-
 Canada
-
 Chile
-
 China
-
 Colombia
-
 Congo
-
 Costa Rica
-
 Cote d'Ivoire
-
 Croatia
-
 Cuba
-
 Cyprus
-
 Czechia
-
 DR Congo
-
 Denmark
-
 Dominican Republic
-
 Ecuador
-
 Egypt
-
 El Salvador
-
 Estonia
-
 Eswatini
-
 Ethiopia
-
 Finland
-
 France
-
 Georgia
-
 Germany
-
 Ghana
-
 Greece
-
 Haiti
-
 Hong Kong
-
 Hungary
-
 India
-
 Indonesia
-
 Iran, Islamic republic
-
 Iraq
-
 Ireland
-
 Israel
-
 Italy
-
 Jamaica
-
 Japan
-
 Jordan
-
 Kazakhstan
-
 Kenya
-
 Korea
-
 Kuwait
-
 Kyrgyzstan
-
 Laos
-
 Latvia
-
 Lebanon
-
 Lesotho
-
 Libya
-
 Lithuania
-
 Luxembourg
-
 Madagascar
-
 Malaysia
-
 Malta
-
 Mauritius
-
 Mexico
-
 Moldova
-
 Mongolia
-
 Montenegro
-
 Morocco
-
 Mozambique
-
 Myanmar
-
 Namibia
-
 Nepal
-
 Netherlands
-
 New Zealand
-
 Nigeria
-
 North Macedonia
-
 Norway
-
 Oman
-
 Pakistan
-
 Palestine
-
 Panama
-
 Papua New Guinea
-
 Paraguay
-
 Peru
-
 Philippines
-
 Poland
-
 Portugal
-
 Puerto Rico
-
 Qatar
-
 Reunion
-
 Romania
-
 Rwanda
-
 Saudi Arabia
-
 Serbia
-
 Singapore
-
 Slovakia
-
 Slovenia
-
 Somalia
-
 South Africa
-
 Spain
-
 Sri Lanka
-
 Sweden
-
 Switzerland
-
 Syria
-
 Taiwan
-
 Tajikistan
-
 Tanzania
-
 Thailand
-
 Trinidad and Tobago
-
 Tunisia
-
 Turkey
-
 UAE
-
 Uganda
-
 Ukraine
-
 United Kingdom
-
United States
-
 Uruguay
-
 Uzbekistan
-
 Venezuela
-
 Vietnam
-
 Yemen
-
 Zambia
-
 Zimbabwe
- Forex
- Crypto












