

Can Persimmon stock break resistance as intraday buying struggles at GBX1,250?

Persimmon (PSN) stock is trading at GBX1,232, up 1.94% on the day. The price remains below its key short- and medium-term moving averages, while holding above longer-term support.
 1301.00
1342.00
Highlights
- Persimmon stock offers a 4.85% dividend yield with a payout ratio of 63.69%, sustaining shareholder returns.
- The company maintains a market capitalization of $3.97 billion and an 8.61% return on equity, supporting its position in the UK housing sector.
- Persimmon stock trades below key short- and medium-term moving averages, with technical indicators suggesting weak momentum and a likely price range of GBX1,168 to GBX1,295 over the coming days.
Stable shareholder returns fuel institutional demand in cautious housing sector
Persimmon’s recently reported dividend yield of 4.85% and a payout ratio of 63.69% confirm the company’s continued commitment to returning cash to shareholders, helping to support investor demand for the stock. The company’s established market capitalization of $3.97 billion highlights its relative stability in the UK housing sector, appealing to larger institutional participants. Additionally, the reported return on equity of 8.61% demonstrates efficient capital usage, which can further sustain investor appetite for shares in the current environment.
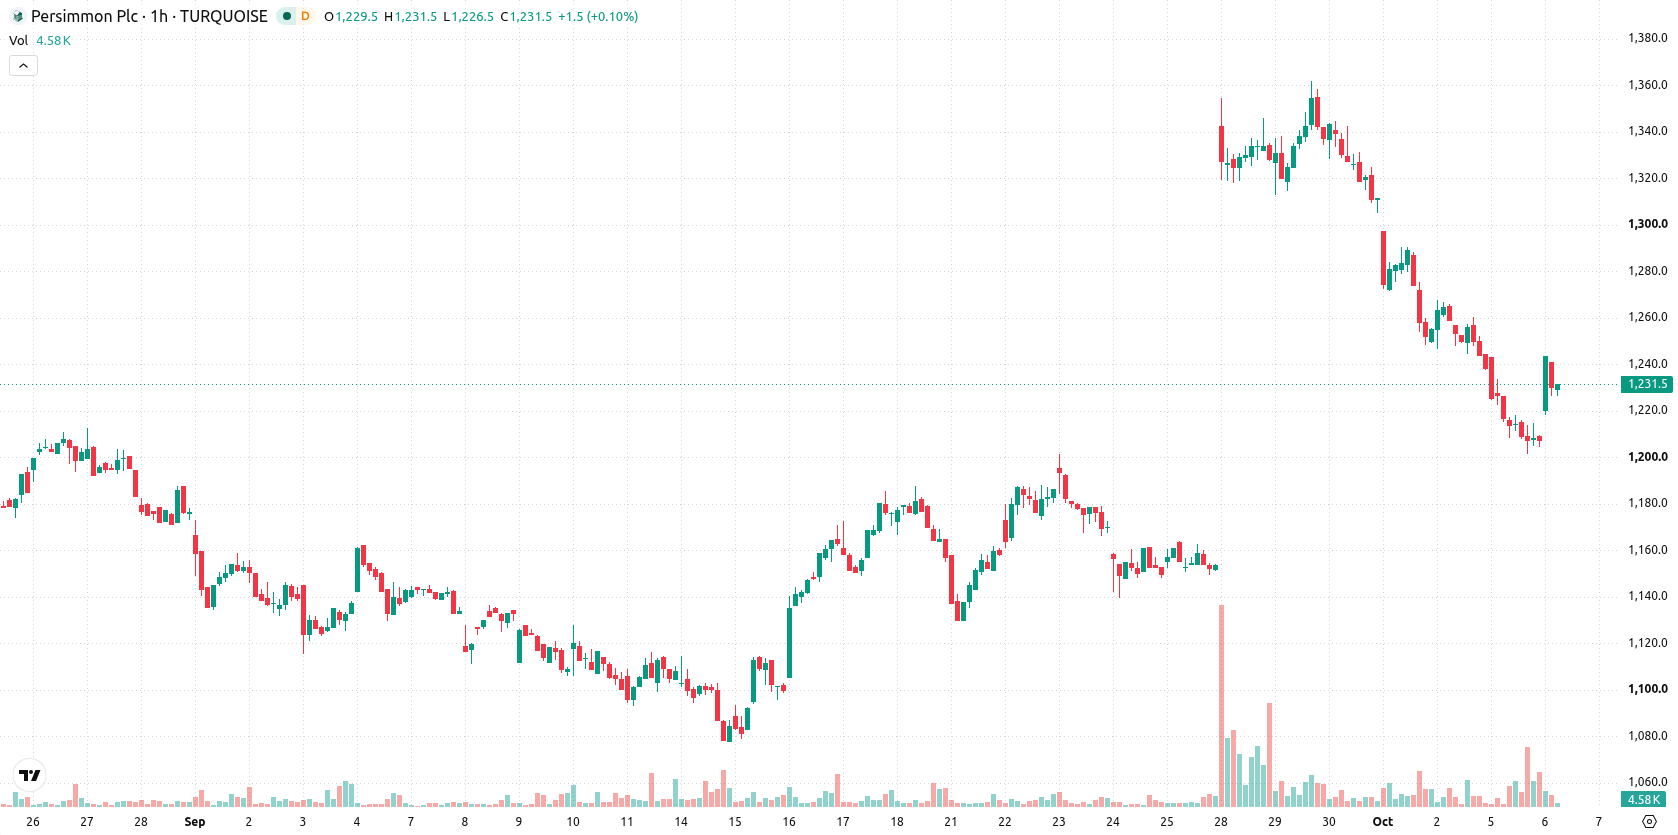
Mixed short-term signals as technical resistance clashes with weak momentum
On the hourly chart, PSN remains below the MA-20 at GBX1,235 and MA-50 at GBX1,281, while above the MA-200 at GBX1,200 on the daily timeframe. Immediate resistance is identified at the Ichimoku Kijun level of GBX1,250. Momentum indicators include MACD at a Strong Sell, ADX at Sell, and RSI registering 46, which aligns with a Sell bias. Stochastic RSI and Bull/Bear Power show overbought signals, CCI is Neutral, and the Awesome Oscillator is also Neutral. This mix of intraday bullish closing and weak momentum signals suggests caution amid divergent short-term and medium-term forces.
Price consolidation likely as risk skews toward further downside
In the short term, PSN is likely to fluctuate within the GBX1,168 to GBX1,295 band, which reflects typical volatility around current price levels. The probability of a further upward move is assessed at 35%, implying a higher likelihood of a downward move. The baseline expectation is for price consolidation within this range, with a potential bullish scenario if price breaks above the Ichimoku Kijun resistance, while a close below the MA-200 could trigger additional selling pressure.
Earlier, analysts noted that Persimmon stock was experiencing mixed technical signals, with short-term weakness tempered by longer-term support. The most recent price action and indicator readings reinforce the case for cautious trading, with a close above GBX1,250 serving as the next key level to signal a potential shift in momentum.











-
 Afghanistan
-
 Albania
-
 Algeria
-
 Angola
-
 Argentina
-
 Armenia
-
 Australia
-
 Austria
-
 Azerbaijan
-
 Bahamas
-
 Bahrain
-
 Bangladesh
-
 Belarus
-
 Belgium
-
 Bolivia
-
 Botswana
-
 Brazil
-
 Brunei
-
 Bulgaria
-
 Cambodia
-
 Cameroon
-
 Canada
-
 Chile
-
 China
-
 Colombia
-
 Congo
-
 Costa Rica
-
 Cote d'Ivoire
-
 Croatia
-
 Cuba
-
 Cyprus
-
 Czechia
-
 DR Congo
-
 Denmark
-
 Dominican Republic
-
 Ecuador
-
 Egypt
-
 El Salvador
-
 Estonia
-
 Eswatini
-
 Ethiopia
-
 Finland
-
 France
-
 Georgia
-
 Germany
-
 Ghana
-
 Greece
-
 Haiti
-
 Hong Kong
-
 Hungary
-
 India
-
 Indonesia
-
 Iran, Islamic republic
-
 Iraq
-
 Ireland
-
 Israel
-
 Italy
-
 Jamaica
-
 Japan
-
 Jordan
-
 Kazakhstan
-
 Kenya
-
 Korea
-
 Kuwait
-
 Kyrgyzstan
-
 Laos
-
 Latvia
-
 Lebanon
-
 Lesotho
-
 Libya
-
 Lithuania
-
 Luxembourg
-
 Madagascar
-
 Malaysia
-
 Malta
-
 Mauritius
-
 Mexico
-
 Moldova
-
 Mongolia
-
 Montenegro
-
 Morocco
-
 Mozambique
-
 Myanmar
-
 Namibia
-
 Nepal
-
 Netherlands
-
 New Zealand
-
 Nigeria
-
 North Macedonia
-
 Norway
-
 Oman
-
 Pakistan
-
 Palestine
-
 Panama
-
 Papua New Guinea
-
 Paraguay
-
 Peru
-
 Philippines
-
 Poland
-
 Portugal
-
 Puerto Rico
-
 Qatar
-
 Reunion
-
 Romania
-
 Rwanda
-
 Saudi Arabia
-
 Serbia
-
 Singapore
-
 Slovakia
-
 Slovenia
-
 Somalia
-
 South Africa
-
 Spain
-
 Sri Lanka
-
 Sweden
-
 Switzerland
-
 Syria
-
 Taiwan
-
 Tajikistan
-
 Tanzania
-
 Thailand
-
 Trinidad and Tobago
-
 Tunisia
-
 Turkey
-
 UAE
-
 Uganda
-
 Ukraine
-
 United Kingdom
-
United States
-
 Uruguay
-
 Uzbekistan
-
 Venezuela
-
 Vietnam
-
 Yemen
-
 Zambia
-
 Zimbabwe
- Forex
- Crypto












