

Equinix shares technical analysis: Weak momentum puts $976.6 support in focus

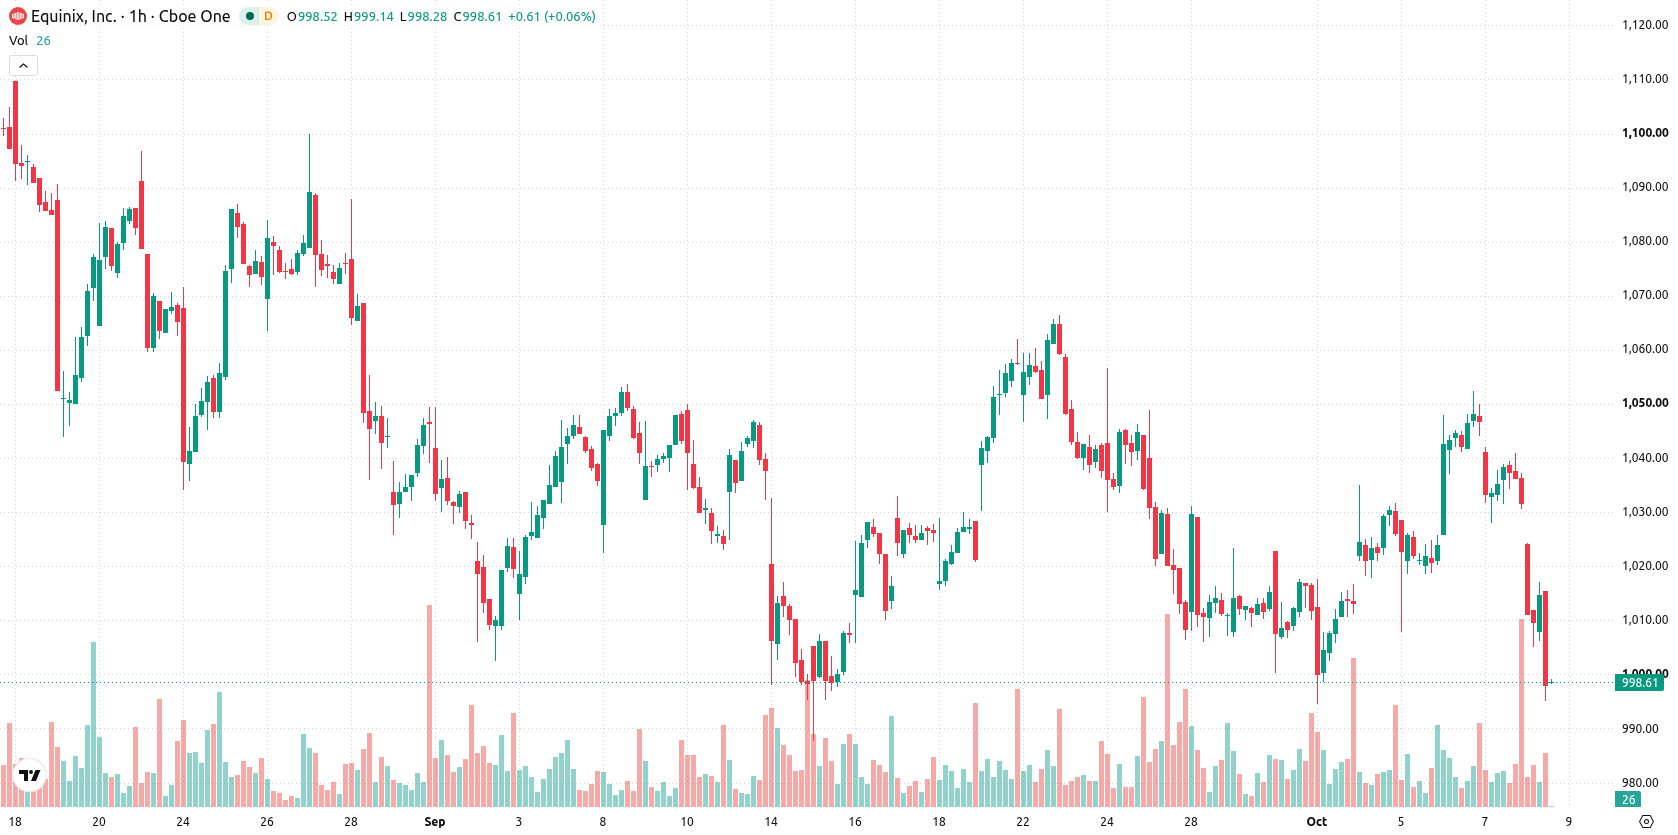
Equinix (EQIX) stock is trading at $996.31, marking a 3.44% decline on the day. The current price is below its key short- and medium-term moving averages but remains above the long-term average, suggesting persistent downward momentum with some underlying support.
 1034.63
1052.31
1034.63
1052.31
Highlights
- EQIX/USD trades below key short- and medium-term moving averages, reflecting prevailing bearish momentum in the short term.
- Momentum indicators are negative and several oscillators show oversold conditions, with sellers dominating intraday price action.
- Price closed at $996.31, with further declines likely into a $976.6 to $1,016 range unless resistance at $1,028 is decisively breached.
Oversold momentum and resistance cap recovery prospects
EQIX is currently positioned below its MA-20 at $1,033 and MA-50 at $1,022, while remaining above the MA-200 at $991. The immediate resistance is indicated by the Ichimoku Kijun at $1,028, and support sits near $976.6. Momentum indicators show a negative configuration: RSI stands at 32.61 (Sell), MACD and ADX are both Neutral, and the Stoch RSI and CCI signal oversold conditions. Bull/Bear Power continues to confirm intraday seller dominance, while the Awesome Oscillator aligns with a strong sell indication.
Downside risks high as breakout above resistance remains elusive
In the next several trading days, the expected price range for EQIX is $976.6 to $1,016, reflecting the typical volatility band relative to current levels. The probability for further downside is high, while upside scenarios remain improbable unless a clear breakout above the Ichimoku Kijun resistance occurs. Should support at $976.6 fail, additional losses are likely, while the baseline view anticipates price consolidation within the projected range.
Earlier, analysts noted that Equinix's technical backdrop had shifted toward sustained strength, highlighted by recent upgrades and resilient price action. The current breakdown below key short- and medium-term averages marks a change in momentum, making the $976.6 support level critical to monitor for potential downside risk.





Latest Equinix News



-
 Afghanistan
-
 Albania
-
 Algeria
-
 Angola
-
 Argentina
-
 Armenia
-
 Australia
-
 Austria
-
 Azerbaijan
-
 Bahamas
-
 Bahrain
-
 Bangladesh
-
 Belarus
-
 Belgium
-
 Bolivia
-
 Botswana
-
 Brazil
-
 Brunei
-
 Bulgaria
-
 Cambodia
-
 Cameroon
-
 Canada
-
 Chile
Chile
-
 China
China
-
 Colombia
-
 Congo
Congo
-
 Costa Rica
-
 Cote d'Ivoire
-
 Croatia
-
 Cuba
Cuba
-
 Cyprus
-
 Czechia
-
 DR Congo
-
 Denmark
-
 Dominican Republic
-
 Ecuador
-
 Egypt
Egypt
-
 El Salvador
-
 Estonia
-
 Eswatini
-
 Ethiopia
-
 Finland
-
 France
-
 Georgia
-
 Germany
-
 Ghana
Ghana
-
 Greece
-
 Haiti
Haiti
-
 Hong Kong
-
 Hungary
-
 India
India
-
 Indonesia
-
 Iran, Islamic republic
-
 Iraq
Iraq
-
 Ireland
-
 Israel
-
 Italy
Italy
-
 Jamaica
-
 Japan
Japan
-
 Jordan
-
 Kazakhstan
-
 Kenya
Kenya
-
 Korea
Korea
-
 Kuwait
-
 Kyrgyzstan
-
 Laos
Laos
-
 Latvia
-
 Lebanon
-
 Lesotho
-
 Libya
Libya
-
 Lithuania
-
 Luxembourg
-
 Madagascar
-
 Malaysia
-
 Malta
Malta
-
 Mauritius
-
 Mexico
-
 Moldova
-
 Mongolia
-
 Montenegro
-
 Morocco
-
 Mozambique
-
 Myanmar
-
 Namibia
-
 Nepal
Nepal
-
 Netherlands
-
 New Zealand
-
 Nigeria
-
 North Macedonia
-
 Norway
-
 Oman
Oman
-
 Pakistan
-
 Palestine
-
 Panama
-
 Papua New Guinea
-
 Paraguay
-
 Peru
Peru
-
 Philippines
-
 Poland
-
 Portugal
-
 Puerto Rico
-
 Qatar
Qatar
-
 Reunion
-
 Romania
-
 Rwanda
-
 Saudi Arabia
-
 Serbia
-
 Singapore
-
 Slovakia
-
 Slovenia
-
 Somalia
-
 South Africa
-
 Spain
Spain
-
 Sri Lanka
-
 Sweden
-
 Switzerland
-
 Syria
Syria
-
 Taiwan
-
 Tajikistan
-
 Tanzania
-
 Thailand
-
 Trinidad and Tobago
-
 Tunisia
-
 Turkey
-
 UAE
UAE
-
 Uganda
-
 Ukraine
-
 United Kingdom
-
United States
-
 Uruguay
-
 Uzbekistan
-
 Venezuela
-
 Vietnam
-
 Yemen
Yemen
-
 Zambia
-
 Zimbabwe
- Forex
- Crypto












