

Rivian stock faces support pressure: Downside targets to watch

Rivian (RIVN) stock is trading at $13.89, closing the day down 3.11%. The price sits below its key moving averages across all major timeframes.
 11.18
12.38
Highlights
- Rivian Automotive secured the full $1 billion funding commitment from Volkswagen Group through their joint venture, immediately increasing liquidity and reducing financing risks.
- The company confirmed its 2026 vehicle delivery guidance after reaching record third quarter production and deliveries.
- Shares of Rivian closed down 3.11% at $13.89 and remain under strong bearish pressure, with technical signals indicating high probability of trading between $13.53 to $14.25 in the coming days.
Liquidity boost from Volkswagen commitment offsets persistent market selling
Rivian Automotive has received the full $1 billion funding commitment from Volkswagen Group through their joint venture, a development that immediately boosts Rivian's liquidity and enhances its financial position, according to Proactiveinvestors. The non-recourse nature of the loan, backed by Rivian’s 50% equity in the venture, reduces financing risks and stabilizes its balance sheet. The company also reaffirmed its 2026 vehicle delivery guidance following record third quarter production and deliveries, as reported by Simplywall, and introduced a Ghostbusters-themed Halloween software update for its vehicles, according to Forbes. These positive corporate actions were accompanied by continued selling pressure in today's market.
Mixed oscillator signals as resistance bands cap rebound potential
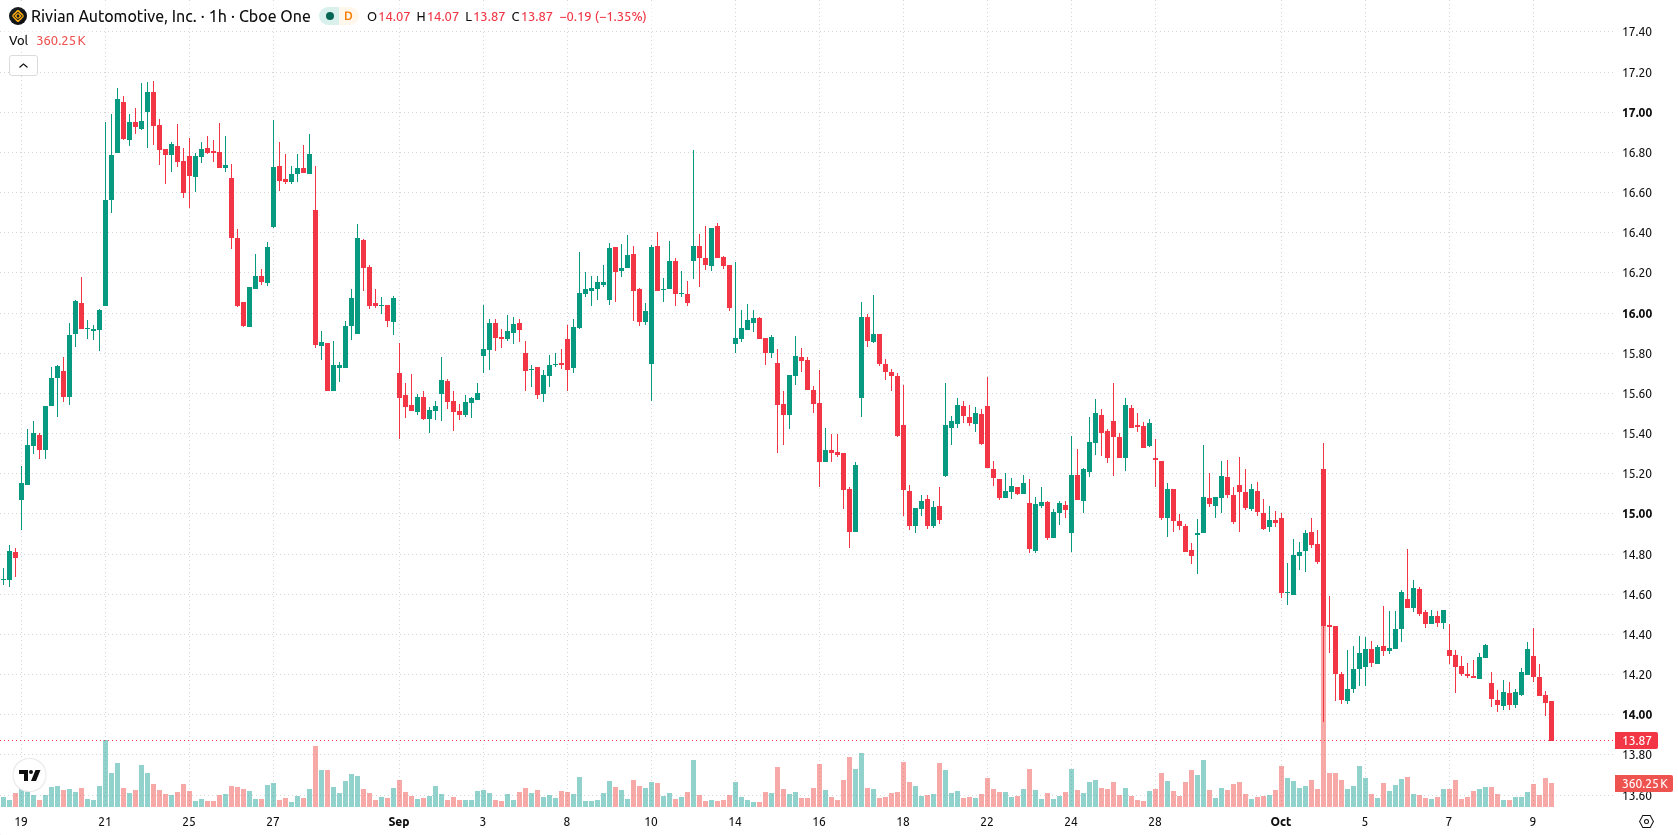
On the technical front, RIVN trades below the MA-20 at $14.28 and the MA-50 at $14.47 on the hourly chart, with the MA-200 on the daily at $16.06, indicating clear resistance bands above current prices. The Ichimoku Kijun sits at $14.42, marking the first major resistance. Oscillator readings are mixed: MACD indicates a strong sell bias, ADX is neutral, and RSI stands at 50.63 with a buy signal. Stochastic RSI shows overbought conditions, while both CCI and the Awesome Oscillator are neutral. Bull/Bear Power reflects notable intraday buying despite the session's close near the low. Combined, the signals illustrate significant divergence between momentum and oscillator indications versus prevailing price action.
Elevated downside risk amid low breakout probability in coming sessions
Over the next several trading sessions, the projected volatility band for RIVN is $13.53 to $14.25. Probability of an upward move is very low, while downside risk remains elevated, making a sustained rally unlikely. The baseline scenario expects RIVN to trade sideways within this range. A bullish breakout above $14.42 could trigger a short squeeze, but a drop below $13.53 would likely signal further downside and confirm persistent selling.
Earlier, analysts noted that Malaysia’s extension of key tax incentives for shipping companies and the disposal of underperforming assets like vessels contributes to sectoral financial resilience. In contrast, Rivian's immediate outlook is shaped by technical resistance and elevated downside risk, with $13.53 identified as the pivotal level that could trigger further losses if breached in upcoming sessions.






Latest Rivian Automotive News



-
 Afghanistan
-
 Albania
-
 Algeria
-
 Angola
-
 Argentina
-
 Armenia
-
 Australia
-
 Austria
-
 Azerbaijan
-
 Bahamas
-
 Bahrain
-
 Bangladesh
-
 Belarus
-
 Belgium
-
 Bolivia
-
 Botswana
-
 Brazil
-
 Brunei
-
 Bulgaria
-
 Cambodia
-
 Cameroon
-
 Canada
-
 Chile
-
 China
-
 Colombia
-
 Congo
-
 Costa Rica
-
 Cote d'Ivoire
-
 Croatia
-
 Cuba
-
 Cyprus
-
 Czechia
-
 DR Congo
-
 Denmark
-
 Dominican Republic
-
 Ecuador
-
 Egypt
-
 El Salvador
-
 Estonia
-
 Eswatini
-
 Ethiopia
-
 Finland
-
 France
-
 Georgia
-
 Germany
-
 Ghana
-
 Greece
-
 Haiti
-
 Hong Kong
-
 Hungary
-
 India
-
 Indonesia
-
 Iran, Islamic republic
-
 Iraq
-
 Ireland
-
 Israel
-
 Italy
-
 Jamaica
-
 Japan
-
 Jordan
-
 Kazakhstan
-
 Kenya
-
 Korea
-
 Kuwait
-
 Kyrgyzstan
-
 Laos
-
 Latvia
-
 Lebanon
-
 Lesotho
-
 Libya
-
 Lithuania
-
 Luxembourg
-
 Madagascar
-
 Malaysia
-
 Malta
-
 Mauritius
-
 Mexico
-
 Moldova
-
 Mongolia
-
 Montenegro
-
 Morocco
-
 Mozambique
-
 Myanmar
-
 Namibia
-
 Nepal
-
 Netherlands
-
 New Zealand
-
 Nigeria
-
 North Macedonia
-
 Norway
-
 Oman
-
 Pakistan
-
 Palestine
-
 Panama
-
 Papua New Guinea
-
 Paraguay
-
 Peru
-
 Philippines
-
 Poland
-
 Portugal
-
 Puerto Rico
-
 Qatar
-
 Reunion
-
 Romania
-
 Rwanda
-
 Saudi Arabia
-
 Serbia
-
 Singapore
-
 Slovakia
-
 Slovenia
-
 Somalia
-
 South Africa
-
 Spain
-
 Sri Lanka
-
 Sweden
-
 Switzerland
-
 Syria
-
 Taiwan
-
 Tajikistan
-
 Tanzania
-
 Thailand
-
 Trinidad and Tobago
-
 Tunisia
-
 Turkey
-
 UAE
-
 Uganda
-
 Ukraine
-
 United Kingdom
-
United States
-
 Uruguay
-
 Uzbekistan
-
 Venezuela
-
 Vietnam
-
 Yemen
-
 Zambia
-
 Zimbabwe
- Forex
- Crypto












