

AbbVie shares weekly forecast: Ongoing consolidation supported by Ichimoku Kijun level at $262.5

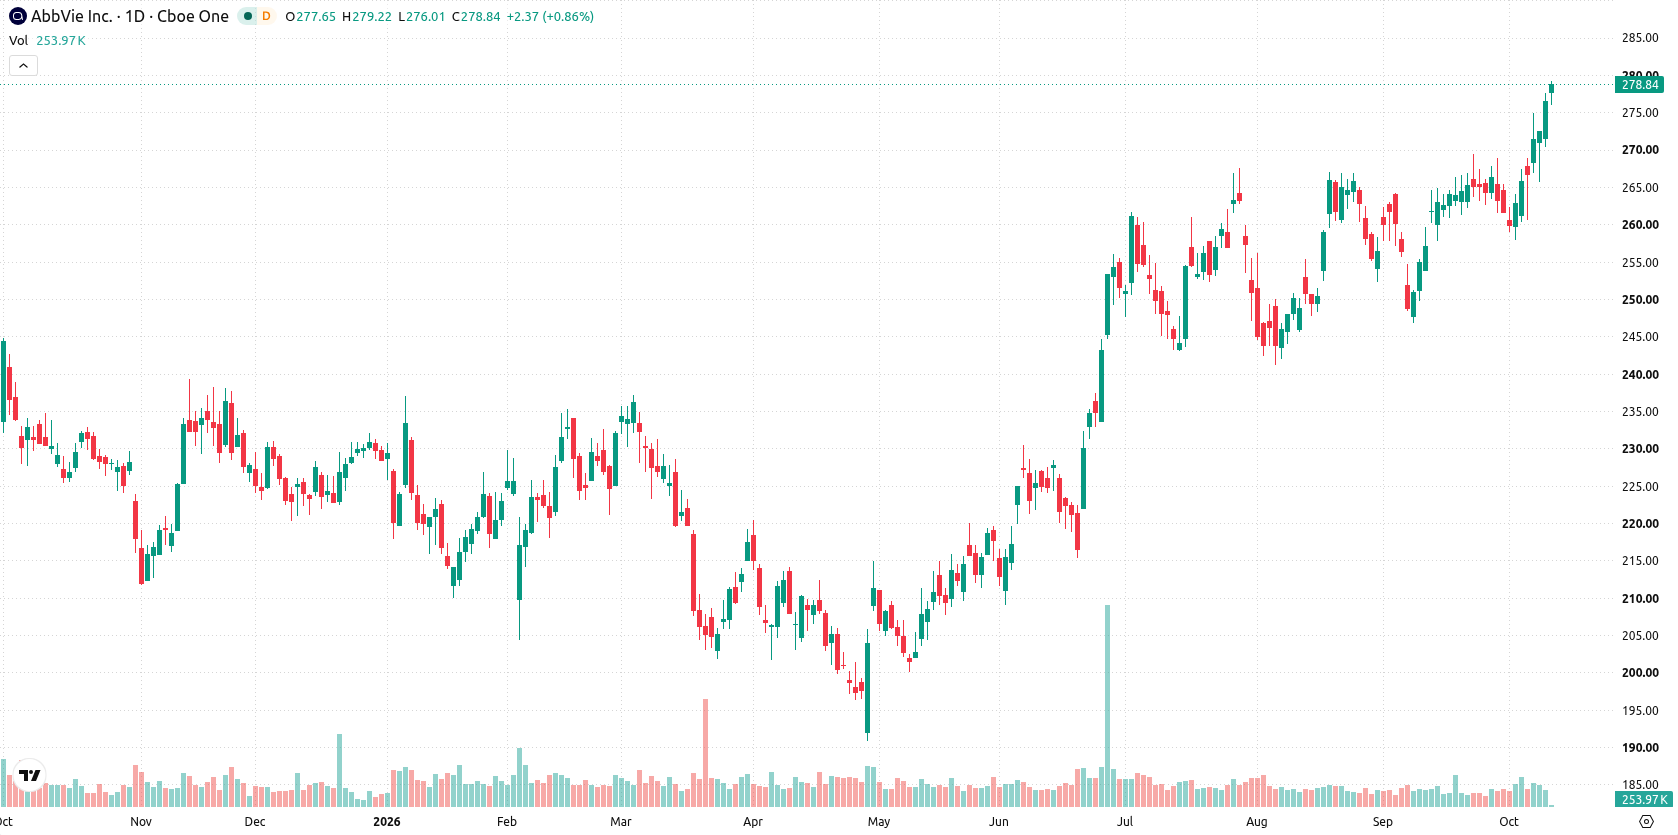
Shares of AbbVie Inc. (ABBV) are trading near $279 as the recovery setup persists, but momentum is increasingly stretched. The small upside this week reflects a tug-of-war between optimistic buyers and overbought signals, with the coming days likely to test whether demand can keep pace near recent highs.
 283.32
281.30
283.32
281.30
Highlights
- Shares of AbbVie rose to $279.49, gaining $3.04 over the last week and trading above key averages.
- The stock remains in a strong bullish structure but technical indicators show an overbought condition near current levels.
- Price is projected to consolidate with an upward bias between $277.55 and $286.94 over the next five sessions, with high probability for further gains.
R&D advances and dividend pressure as deal activity drives sentiment this week
AbbVie presented 22 research abstracts from its inflammatory bowel disease portfolio at the American College of Gastroenterology Annual Scientific Meeting on October 11, 2026, highlighting continued R&D efforts. The company also revealed it expects a $216 million pre-tax charge in third-quarter results tied to acquired in-process R&D and milestone expenses. In the same period, AbbVie completed its acquisition of Apogee Therapeutics and received new U.S. FDA approval for a product, while its dividend yield has dropped to the lowest level since 2018 but remains recognized for consistent payouts.
Overbought readings build as price tests top of narrow weekly range
On the daily chart, AbbVie is positioned at the very top of its weekly range, with price action showing a contained move within a narrow range as volatility over the past week reached 6.39%. Both the RSI at 71.08 and CCI at 273.51 indicate an overbought condition, while the MACD remains in buy territory. Immediate support is marked at $277.55, and the Ichimoku Kijun at $262.5 offers another practical backstop, suggesting the prevailing momentum favors buyers, but overbought signals warrant caution near current levels.
Consolidation with upside bias expected barring sustained move below support
For the next five trading days, the expected range is $272.03 to $286.94. There is a very high probability of an increase and a very low probability of a decrease. The base case is continued consolidation with an upward bias between $277.55 and $286.94. A bullish scenario would see a sustained push above $286.94, while a bearish shift would require a move below support at $277.55.
Earlier, analysts noted that AbbVie's sustained bullish trend was underpinned by consistent clinical progress and strong technical momentum, though overbought signals required caution. The current setup extends this outlook, and traders should monitor a potential bullish breakout above $286.94 as the next inflection point for directional confirmation.










-
 Afghanistan
-
 Albania
-
 Algeria
-
 Angola
-
 Argentina
-
 Armenia
-
 Australia
-
 Austria
-
 Azerbaijan
-
 Bahamas
-
 Bahrain
-
 Bangladesh
-
 Belarus
-
 Belgium
-
 Bolivia
-
 Botswana
-
 Brazil
-
 Brunei
-
 Bulgaria
-
 Cambodia
-
 Cameroon
-
 Canada
-
 Chile
Chile
-
 China
China
-
 Colombia
-
 Congo
Congo
-
 Costa Rica
-
 Cote d'Ivoire
-
 Croatia
-
 Cuba
Cuba
-
 Cyprus
-
 Czechia
-
 DR Congo
-
 Denmark
-
 Dominican Republic
-
 Ecuador
-
 Egypt
Egypt
-
 El Salvador
-
 Estonia
-
 Eswatini
-
 Ethiopia
-
 Finland
-
 France
-
 Georgia
-
 Germany
-
 Ghana
Ghana
-
 Greece
-
 Haiti
Haiti
-
 Hong Kong
-
 Hungary
-
 India
India
-
 Indonesia
-
 Iran, Islamic republic
-
 Iraq
Iraq
-
 Ireland
-
 Israel
-
 Italy
Italy
-
 Jamaica
-
 Japan
Japan
-
 Jordan
-
 Kazakhstan
-
 Kenya
Kenya
-
 Korea
Korea
-
 Kuwait
-
 Kyrgyzstan
-
 Laos
Laos
-
 Latvia
-
 Lebanon
-
 Lesotho
-
 Libya
Libya
-
 Lithuania
-
 Luxembourg
-
 Madagascar
-
 Malaysia
-
 Malta
Malta
-
 Mauritius
-
 Mexico
-
 Moldova
-
 Mongolia
-
 Montenegro
-
 Morocco
-
 Mozambique
-
 Myanmar
-
 Namibia
-
 Nepal
Nepal
-
 Netherlands
-
 New Zealand
-
 Nigeria
-
 North Macedonia
-
 Norway
-
 Oman
Oman
-
 Pakistan
-
 Palestine
-
 Panama
-
 Papua New Guinea
-
 Paraguay
-
 Peru
Peru
-
 Philippines
-
 Poland
-
 Portugal
-
 Puerto Rico
-
 Qatar
Qatar
-
 Reunion
-
 Romania
-
 Rwanda
-
 Saudi Arabia
-
 Serbia
-
 Singapore
-
 Slovakia
-
 Slovenia
-
 Somalia
-
 South Africa
-
 Spain
Spain
-
 Sri Lanka
-
 Sweden
-
 Switzerland
-
 Syria
Syria
-
 Taiwan
-
 Tajikistan
-
 Tanzania
-
 Thailand
-
 Trinidad and Tobago
-
 Tunisia
-
 Turkey
-
 UAE
UAE
-
 Uganda
-
 Ukraine
-
 United Kingdom
-
United States
-
 Uruguay
-
 Uzbekistan
-
 Venezuela
-
 Vietnam
-
 Yemen
Yemen
-
 Zambia
-
 Zimbabwe
- Forex
- Crypto












