

Tesla shares technical analysis: Range-bound trading persists with buyer support near immediate support

Tesla (TSLA) stock is trading at $379.58 after a modest daily decline. The price is tracking above its key short- and medium-term moving averages, but remains below levels that would indicate a longer-term reversal.
 382.41
388.12
382.41
388.12
Highlights
- Tesla will release third quarter 2026 financial results on October 21, 2026, with a live management Q and A event.
- Tesla has rebranded Full Self-Driving in Europe to Assisted Driving to comply with German transport regulations and continues proprietary chip development through the Terafab program.
- Shares of Tesla are forecast to trade within $370.7 to $388.46 for the next several sessions, with technicals supporting medium-term bullish momentum but short-term signals mixed.
Investor focus rises as earnings call and product changes drive sentiment
Tesla has confirmed its third quarter 2026 earnings call will be held on October 21, 2026, with financial results released after the market close and a live management Q&A, according to Basenor. This scheduled disclosure draws investor focus toward upcoming financial transparency and leadership commentary, which can shape near-term expectations for the company's performance and outlook. In Europe, Tesla rebranded its 'Full Self-Driving (Supervised)' to 'Tesla Assisted Driving' in response to regulatory directives from the German Ministry of Transport, as reported by Fredzone, reflecting ongoing regional compliance and product positioning efforts. Additionally, Elon Musk's official launch of the 'Terafab' chip program and parallel engineering recruitment, highlighted by Basenor, points to continued investment in proprietary technology and future product capabilities.
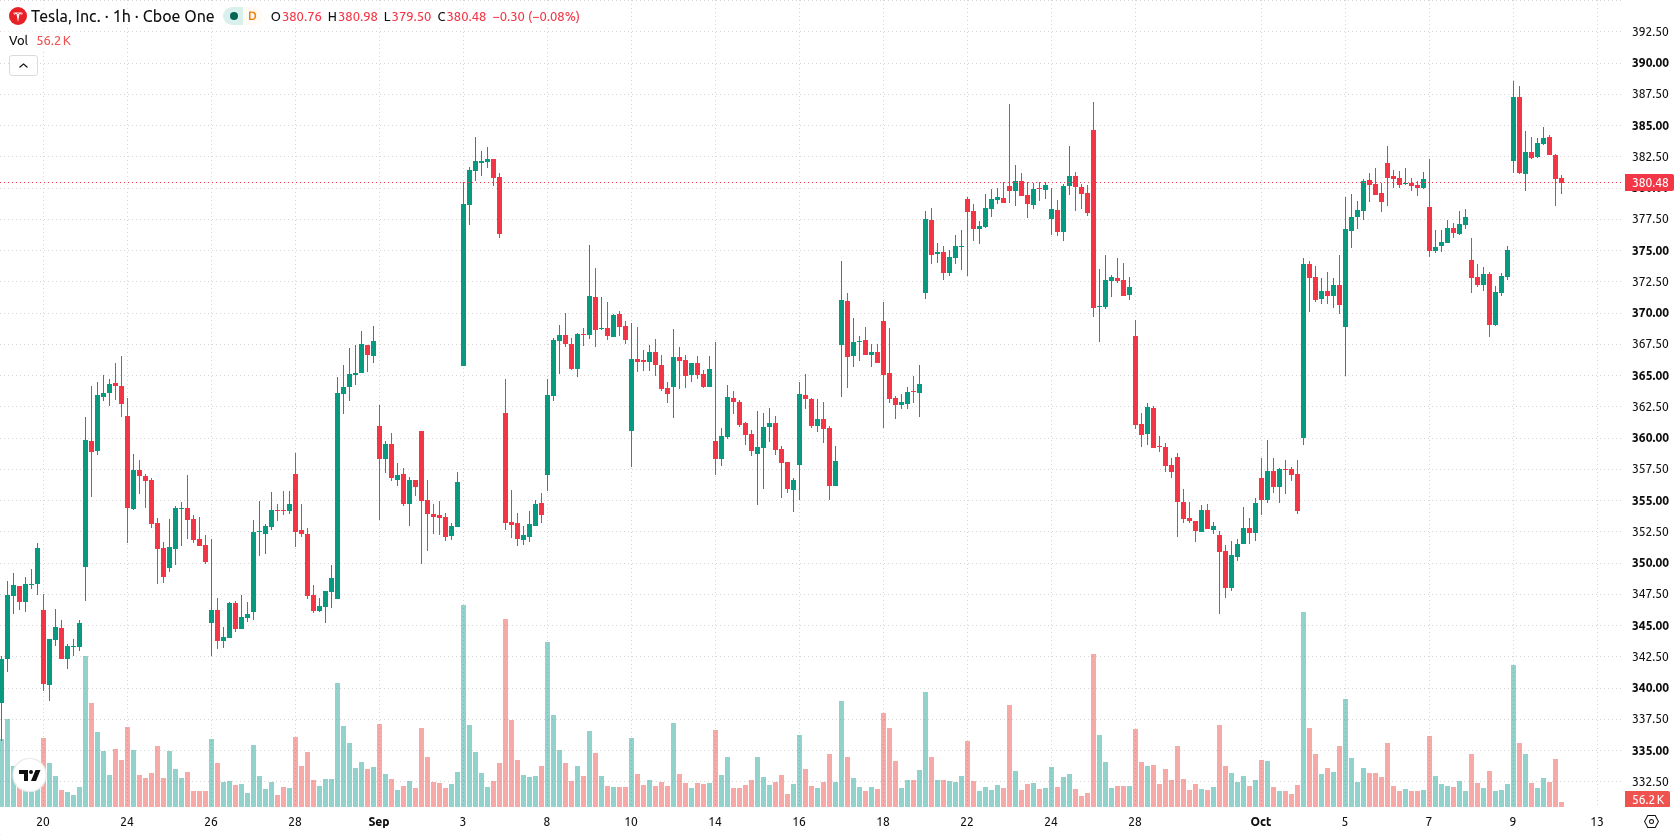
Mixed momentum signals as price tests support and approaches key averages
TSLA is trading above its MA-20 at $377.49 and MA-50 at $374.81 on the h1 chart, but remains below the daily MA-200 at $390.55. The Ichimoku Kijun on the daily chart sits at $378.29 and acts as an immediate support level. Momentum indicators display a mixed picture: both MACD and ADX give buy signals, CCI is bullish, and RSI holds at 58.73, showing modest bullishness. Stochastic RSI presents a sell signal, the Awesome Oscillator is neutral, and Bull/Bear Power is overbought, confirming current buyer strength but suggesting short-term exhaustion.
Breakout risk as sideways trading dominates short-term outlook
For the coming sessions, TSLA is expected to trade within a volatility band of $370.7 to $388.46. There is a 67% probability of an upward move, while downside odds are at 33%. The baseline scenario sees sideways trading within this band. Should TSLA break out above $388.46, an extended move higher may follow; a move below $370.7 would open the door to further declines.
Earlier, analysts noted that Tesla's share price was at a pivotal technical juncture amid rising volatility and major product developments. The current setup adds a new dimension, with technical signals pointing to potential sideways movement and a key focus on the stock's ability to maintain trading within the $370.7 to $388.46 volatility band in the near term.





Latest Tesla News





-
 Afghanistan
-
 Albania
-
 Algeria
-
 Angola
-
 Argentina
-
 Armenia
-
 Australia
-
 Austria
-
 Azerbaijan
-
 Bahamas
-
 Bahrain
-
 Bangladesh
-
 Belarus
-
 Belgium
-
 Bolivia
-
 Botswana
-
 Brazil
-
 Brunei
-
 Bulgaria
-
 Cambodia
-
 Cameroon
-
 Canada
-
 Chile
Chile
-
 China
China
-
 Colombia
-
 Congo
Congo
-
 Costa Rica
-
 Cote d'Ivoire
-
 Croatia
-
 Cuba
Cuba
-
 Cyprus
-
 Czechia
-
 DR Congo
-
 Denmark
-
 Dominican Republic
-
 Ecuador
-
 Egypt
Egypt
-
 El Salvador
-
 Estonia
-
 Eswatini
-
 Ethiopia
-
 Finland
-
 France
-
 Georgia
-
 Germany
-
 Ghana
Ghana
-
 Greece
-
 Haiti
Haiti
-
 Hong Kong
-
 Hungary
-
 India
India
-
 Indonesia
-
 Iran, Islamic republic
-
 Iraq
Iraq
-
 Ireland
-
 Israel
-
 Italy
Italy
-
 Jamaica
-
 Japan
Japan
-
 Jordan
-
 Kazakhstan
-
 Kenya
Kenya
-
 Korea
Korea
-
 Kuwait
-
 Kyrgyzstan
-
 Laos
Laos
-
 Latvia
-
 Lebanon
-
 Lesotho
-
 Libya
Libya
-
 Lithuania
-
 Luxembourg
-
 Madagascar
-
 Malaysia
-
 Malta
Malta
-
 Mauritius
-
 Mexico
-
 Moldova
-
 Mongolia
-
 Montenegro
-
 Morocco
-
 Mozambique
-
 Myanmar
-
 Namibia
-
 Nepal
Nepal
-
 Netherlands
-
 New Zealand
-
 Nigeria
-
 North Macedonia
-
 Norway
-
 Oman
Oman
-
 Pakistan
-
 Palestine
-
 Panama
-
 Papua New Guinea
-
 Paraguay
-
 Peru
Peru
-
 Philippines
-
 Poland
-
 Portugal
-
 Puerto Rico
-
 Qatar
Qatar
-
 Reunion
-
 Romania
-
 Rwanda
-
 Saudi Arabia
-
 Serbia
-
 Singapore
-
 Slovakia
-
 Slovenia
-
 Somalia
-
 South Africa
-
 Spain
Spain
-
 Sri Lanka
-
 Sweden
-
 Switzerland
-
 Syria
Syria
-
 Taiwan
-
 Tajikistan
-
 Tanzania
-
 Thailand
-
 Trinidad and Tobago
-
 Tunisia
-
 Turkey
-
 UAE
UAE
-
 Uganda
-
 Ukraine
-
 United Kingdom
-
United States
-
 Uruguay
-
 Uzbekistan
-
 Venezuela
-
 Vietnam
-
 Yemen
Yemen
-
 Zambia
-
 Zimbabwe
- Forex
- Crypto












