

Intel stock forecast: Range-bound action expected as seller pressure dominates

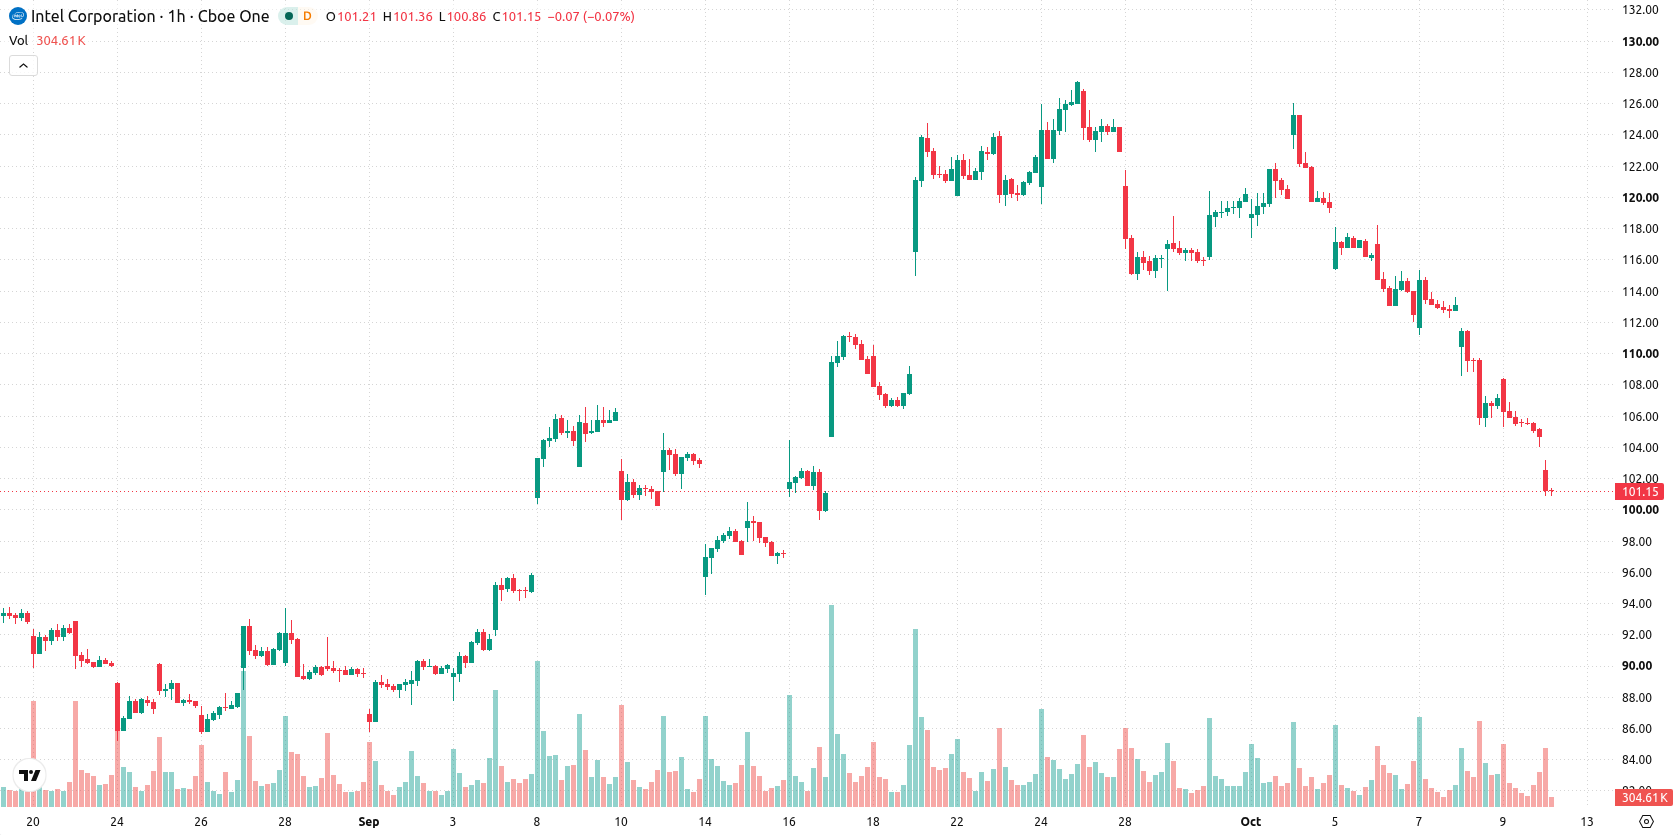
Intel (INTC) stock is trading at $101.02, registering a daily decrease of 3.5%. The price action sits below its key short- and medium-term moving averages, with ongoing support from longer-term trends.
 102.57
116.52
102.57
116.52
Highlights
- Intel reached 500 million cumulative downloads for its AI, machine learning, and Python tools through Anaconda, showing widespread developer adoption.
- CEO Lip-Bu Tan affirms strategic commitment to open-source development and describes cost-effective Chinese open-weight AI models for new applications.
- Shares of Intel fell 3.5% to $101.02 as technicals indicate persistent selling pressure, with price expected to consolidate in a $95.51 to $106.53 range.
Ecosystem adoption rises as software milestone supports AI push
Intel surpassed 500 million cumulative downloads for its AI, machine learning, and Python tools through Anaconda, a milestone that underscores widespread adoption by developers and data scientists, according to Yahoo Finance. This broad software uptake points to an increasingly entrenched role for Intel’s ecosystem in AI and data workflows. Additionally, CEO Lip-Bu Tan has emphasized strategic commitment to open-source development and highlighted the cost-effectiveness of Chinese open-weight AI models for new applications, as reported by Investorshub Advfn and Stocktwits. Together, these factors reinforce Intel’s orientation towards expanding its influence in emerging AI and quantum computing spaces, though price action has remained under broader selling pressure.
Bearish momentum persists as oversold signals and resistance converge
INTC/USD is positioned below the MA-20 at $108.69 and the MA-50 at $114.13, while remaining above the MA-200 at $83.01. Immediate resistance stands at the Ichimoku Kijun level of $109.75. Momentum indicators remain negative, with both MACD and ADX signaling ongoing selling pressure. RSI at 22.55, along with Stochastic RSI and CCI, highlight oversold conditions, while Bull/Bear Power continues to reflect intraday seller dominance.
Consolidation likely as downside risk overshadows rebound prospects
Over the coming sessions, INTC/USD is expected to trade within the $95.51 to $106.53 range, which represents a typical volatility band relative to current levels. Downside risk is assessed as having a high probability, whereas the likelihood of a significant recovery is low. The baseline scenario is sideways consolidation inside this range, with a bullish breakout requiring a decisive move above immediate resistance and a bearish extension likely if support is breached.
Earlier, analysts noted that Intel’s near-term stock action was expected to remain pressured within a range, with volatility shaped by both technical factors and its strategic partnerships. The latest data on deepening AI software adoption and further negative momentum signals suggest INTC remains susceptible to further downside, making vigilance around the $95.51 support area critical in the sessions ahead.









-
 Afghanistan
-
 Albania
-
 Algeria
-
 Angola
-
 Argentina
-
 Armenia
-
 Australia
-
 Austria
-
 Azerbaijan
-
 Bahamas
-
 Bahrain
-
 Bangladesh
-
 Belarus
-
 Belgium
-
 Bolivia
-
 Botswana
-
 Brazil
-
 Brunei
-
 Bulgaria
-
 Cambodia
-
 Cameroon
-
 Canada
-
 Chile
Chile
-
 China
China
-
 Colombia
-
 Congo
Congo
-
 Costa Rica
-
 Cote d'Ivoire
-
 Croatia
-
 Cuba
Cuba
-
 Cyprus
-
 Czechia
-
 DR Congo
-
 Denmark
-
 Dominican Republic
-
 Ecuador
-
 Egypt
Egypt
-
 El Salvador
-
 Estonia
-
 Eswatini
-
 Ethiopia
-
 Finland
-
 France
-
 Georgia
-
 Germany
-
 Ghana
Ghana
-
 Greece
-
 Haiti
Haiti
-
 Hong Kong
-
 Hungary
-
 India
India
-
 Indonesia
-
 Iran, Islamic republic
-
 Iraq
Iraq
-
 Ireland
-
 Israel
-
 Italy
Italy
-
 Jamaica
-
 Japan
Japan
-
 Jordan
-
 Kazakhstan
-
 Kenya
Kenya
-
 Korea
Korea
-
 Kuwait
-
 Kyrgyzstan
-
 Laos
Laos
-
 Latvia
-
 Lebanon
-
 Lesotho
-
 Libya
Libya
-
 Lithuania
-
 Luxembourg
-
 Madagascar
-
 Malaysia
-
 Malta
Malta
-
 Mauritius
-
 Mexico
-
 Moldova
-
 Mongolia
-
 Montenegro
-
 Morocco
-
 Mozambique
-
 Myanmar
-
 Namibia
-
 Nepal
Nepal
-
 Netherlands
-
 New Zealand
-
 Nigeria
-
 North Macedonia
-
 Norway
-
 Oman
Oman
-
 Pakistan
-
 Palestine
-
 Panama
-
 Papua New Guinea
-
 Paraguay
-
 Peru
Peru
-
 Philippines
-
 Poland
-
 Portugal
-
 Puerto Rico
-
 Qatar
Qatar
-
 Reunion
-
 Romania
-
 Rwanda
-
 Saudi Arabia
-
 Serbia
-
 Singapore
-
 Slovakia
-
 Slovenia
-
 Somalia
-
 South Africa
-
 Spain
Spain
-
 Sri Lanka
-
 Sweden
-
 Switzerland
-
 Syria
Syria
-
 Taiwan
-
 Tajikistan
-
 Tanzania
-
 Thailand
-
 Trinidad and Tobago
-
 Tunisia
-
 Turkey
-
 UAE
UAE
-
 Uganda
-
 Ukraine
-
 United Kingdom
-
United States
-
 Uruguay
-
 Uzbekistan
-
 Venezuela
-
 Vietnam
-
 Yemen
Yemen
-
 Zambia
-
 Zimbabwe
- Forex
- Crypto












