

SNDL slides over 3% as bearish indicators reinforce short-term weakness

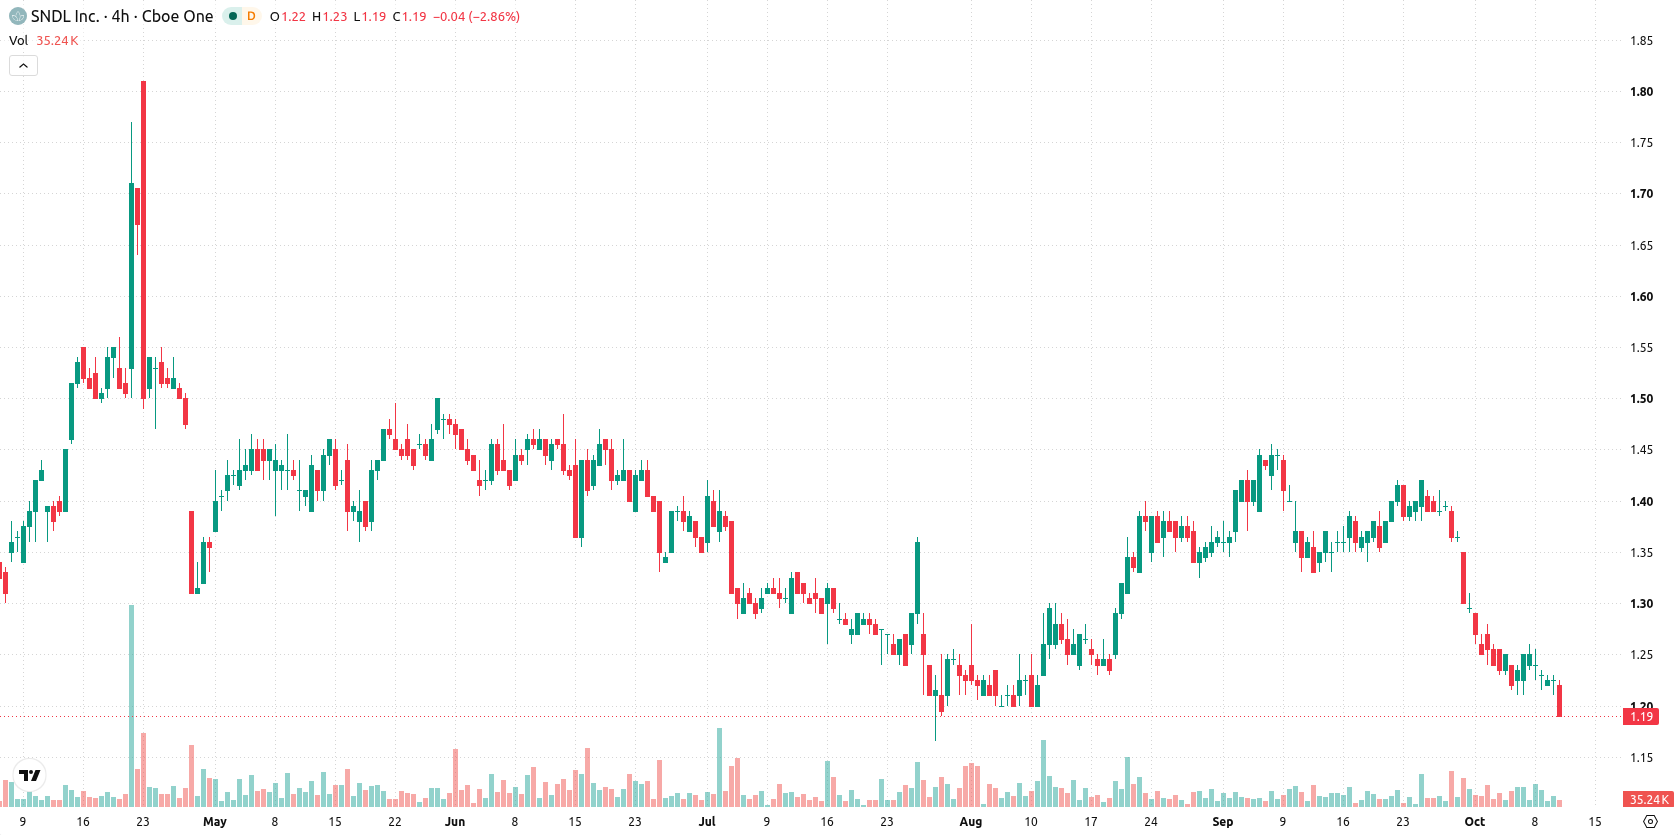
SNDL Inc. (SNDL) fell 3.27% amid persistent selling pressure, as technical momentum remains firmly negative. The bearish setup is supported by SNDL continuing to trade below its key 20-day, 50-day, and 200-day moving averages, reflecting seller control across timeframes.
 1.21
1.26
1.21
1.26
Highlights
- SNDL stock trades persistently below key moving averages, with sellers dominating in short, medium, and long-term horizons.
- Bearish momentum signals and multiple oversold indicators suggest continued risk of near-term weakness for SNDL stock.
- SNDL stock trades in a narrow range between $1.16 and $1.21, with a very high probability of further decline.
Bearish momentum and oversold signals reinforce near-term weakness
SNDL remains under notable pressure, with the price at $1.19 trading below its 20-day ($1.33), 50-day ($1.32), and 200-day ($1.43) moving averages. This persistent sub-MA positioning illustrates dominance from sellers across the short, medium, and long-term, and the bearish MA-50 vs MA-200 alignment further reinforces a weak bias for the stock. Immediate trading is confined by a near-term ceiling at $1.21 and a floor at $1.16. Momentum signals are predominantly bearish, as both the MACD and RSI indicate a selling bias, with the MACD at -0.05 and RSI slipping into oversold territory at 34.37. The Commodity Channel Index (CCI) and Stochastic RSI are also deeply oversold, suggesting downside exhaustion. The Bull/Bear Power (BBP) reading of -0.05 confirms sellers still control intraday dynamics. The Awesome Oscillator (AO) echoes this with a negative value, and the Average Directional Index (ADX) signals a lack of a strong trend. The stock opened with a downside gap of nearly $0.02 (1.63%), and the price has slipped $0.04 or 3.27% on the day, trading at the very bottom of a tight intraday range, where volatility stands at 0.00%. There is clear persistent selling pressure after the open, with no intraday recovery so far, and oversold oscillators point to continued risk of near-term weakness.
Earlier, analysts noted that limited domestic liquidity and market participation can present challenges for newly listed shares, often leading to constrained trading dynamics. The current technical setup for SNDL reinforces these challenges, with a very high likelihood of continued downside as the stock remains confined within a narrow $1.16 to $1.21 range.










-
 Afghanistan
-
 Albania
-
 Algeria
-
 Angola
-
 Argentina
-
 Armenia
-
 Australia
-
 Austria
-
 Azerbaijan
-
 Bahamas
-
 Bahrain
-
 Bangladesh
-
 Belarus
-
 Belgium
-
 Bolivia
-
 Botswana
-
 Brazil
-
 Brunei
-
 Bulgaria
-
 Cambodia
-
 Cameroon
-
 Canada
-
 Chile
Chile
-
 China
China
-
 Colombia
-
 Congo
Congo
-
 Costa Rica
-
 Cote d'Ivoire
-
 Croatia
-
 Cuba
Cuba
-
 Cyprus
-
 Czechia
-
 DR Congo
-
 Denmark
-
 Dominican Republic
-
 Ecuador
-
 Egypt
Egypt
-
 El Salvador
-
 Estonia
-
 Eswatini
-
 Ethiopia
-
 Finland
-
 France
-
 Georgia
-
 Germany
-
 Ghana
Ghana
-
 Greece
-
 Haiti
Haiti
-
 Hong Kong
-
 Hungary
-
 India
India
-
 Indonesia
-
 Iran, Islamic republic
-
 Iraq
Iraq
-
 Ireland
-
 Israel
-
 Italy
Italy
-
 Jamaica
-
 Japan
Japan
-
 Jordan
-
 Kazakhstan
-
 Kenya
Kenya
-
 Korea
Korea
-
 Kuwait
-
 Kyrgyzstan
-
 Laos
Laos
-
 Latvia
-
 Lebanon
-
 Lesotho
-
 Libya
Libya
-
 Lithuania
-
 Luxembourg
-
 Madagascar
-
 Malaysia
-
 Malta
Malta
-
 Mauritius
-
 Mexico
-
 Moldova
-
 Mongolia
-
 Montenegro
-
 Morocco
-
 Mozambique
-
 Myanmar
-
 Namibia
-
 Nepal
Nepal
-
 Netherlands
-
 New Zealand
-
 Nigeria
-
 North Macedonia
-
 Norway
-
 Oman
Oman
-
 Pakistan
-
 Palestine
-
 Panama
-
 Papua New Guinea
-
 Paraguay
-
 Peru
Peru
-
 Philippines
-
 Poland
-
 Portugal
-
 Puerto Rico
-
 Qatar
Qatar
-
 Reunion
-
 Romania
-
 Rwanda
-
 Saudi Arabia
-
 Serbia
-
 Singapore
-
 Slovakia
-
 Slovenia
-
 Somalia
-
 South Africa
-
 Spain
Spain
-
 Sri Lanka
-
 Sweden
-
 Switzerland
-
 Syria
Syria
-
 Taiwan
-
 Tajikistan
-
 Tanzania
-
 Thailand
-
 Trinidad and Tobago
-
 Tunisia
-
 Turkey
-
 UAE
UAE
-
 Uganda
-
 Ukraine
-
 United Kingdom
-
United States
-
 Uruguay
-
 Uzbekistan
-
 Venezuela
-
 Vietnam
-
 Yemen
Yemen
-
 Zambia
-
 Zimbabwe
- Forex
- Crypto












