

SNDL shares technical analysis: Neutral momentum counters daily downside while support is nearby

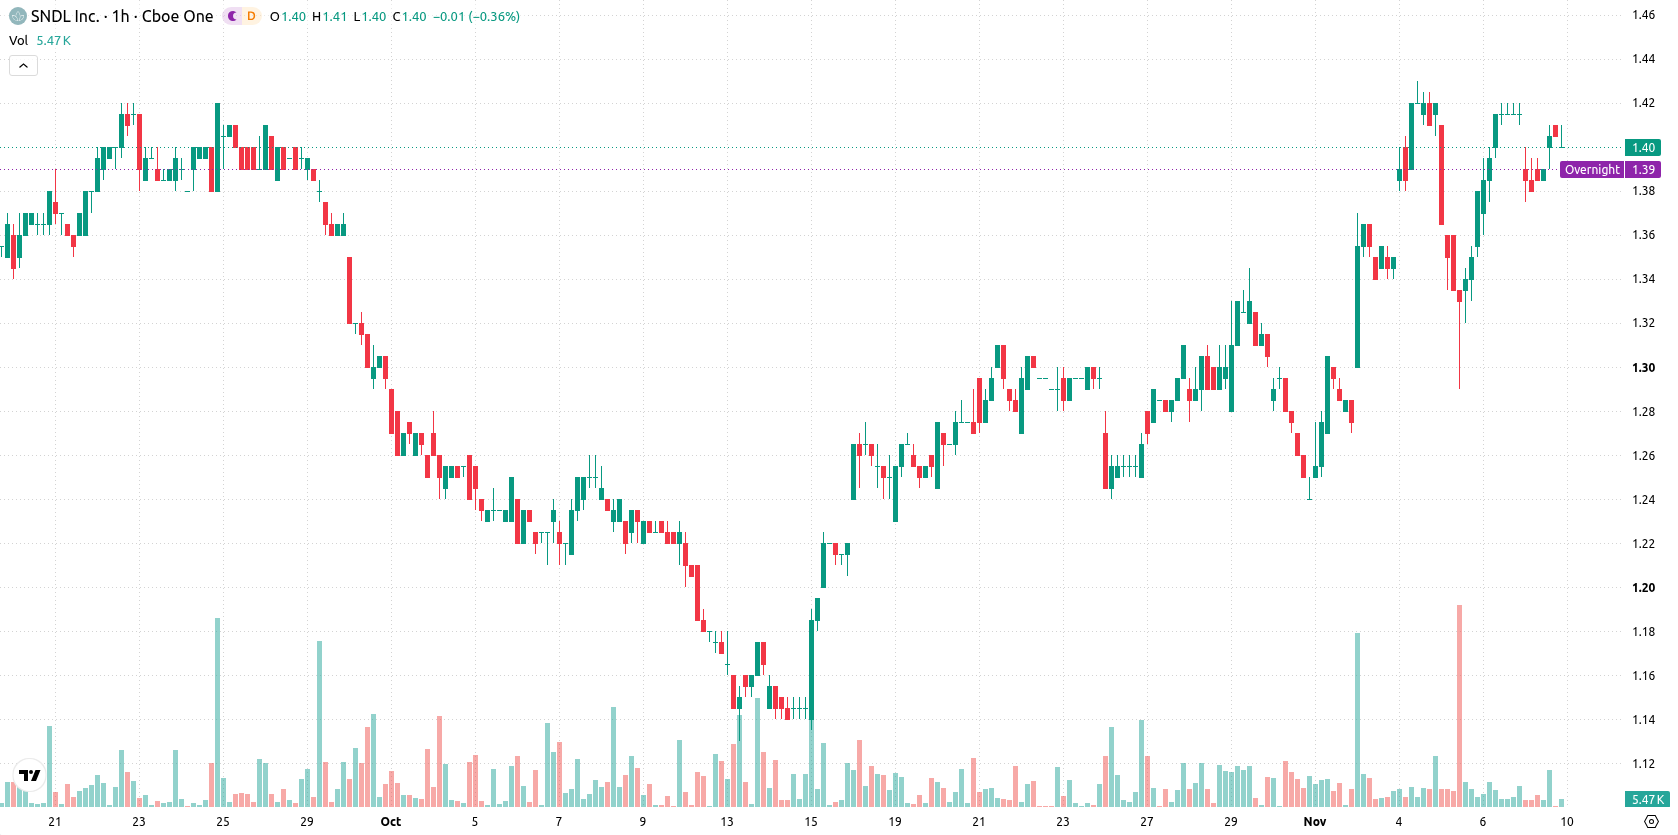
SNDL (SNDL) stock is trading at $1.4, marking a daily decrease of 1.41%. The price remains above its key moving averages, indicating resilience relative to recent reference levels.
 1.39
1.42
Highlights
- SNDL stock maintains a bullish technical structure, trading above key short- and long-term moving averages.
- Momentum signals are mixed, with MACD in strong buy territory but oscillators such as RSI, Stoch RSI, and CCI remaining neutral.
- Price is expected to consolidate between $1.34 and $1.46 in the next 2 to 3 days, with a 76% probability of an upward move.
Mixed momentum as price holds above long-term supports
On the technical side, SNDL is trading above its MA-20, MA-50, and MA-200, confirming short- and medium-term momentum with price levels above long-term benchmarks. The Ichimoku Kijun sits at $1.36, providing immediate support. Momentum indicators are mixed: MACD registers a strong buy, ADX remains neutral, and all oscillators—RSI, Stoch RSI, and CCI—are neutral, indicating the absence of extreme conditions. Bull/Bear Power is slightly positive at 0.02, reflecting marginal buyer activity intraday. The price closed near the high of the day amid moderate volatility, but the neutral oscillator readings in the face of a price drop highlight divergence with the bullish MACD.
Upside favored as consolidation defines trading corridor
Over the next 2–3 trading days, the expected price corridor for SNDL is $1.34 to $1.46 based on typical volatility. There is a 76% probability of an upward move and a 24% chance of a downward move, making an upside scenario more likely. The base case anticipates price consolidation within this corridor. If bullish momentum prevails, a move above resistance may target the upper bound, while a break below support at $1.36 could expose the lower end of the range.
Earlier, analysts noted that SNDL maintained a generally bullish technical structure as long as momentum was supported and key support levels held. The current analysis reinforces this view with price action remaining above major moving averages, but highlights that traders should monitor the $1.36 support, as a decisive move below this level could trigger increased volatility toward the lower end of the expected range.









-
 Afghanistan
-
 Albania
-
 Algeria
-
 Angola
-
 Argentina
-
 Armenia
-
 Australia
-
 Austria
-
 Azerbaijan
-
 Bahamas
-
 Bahrain
-
 Bangladesh
-
 Belarus
-
 Belgium
-
 Bolivia
-
 Botswana
-
 Brazil
-
 Brunei
-
 Bulgaria
-
 Cambodia
-
 Cameroon
-
 Canada
-
 Chile
-
 China
-
 Colombia
-
 Congo
-
 Costa Rica
-
 Cote d'Ivoire
-
 Croatia
-
 Cuba
-
 Cyprus
-
 Czechia
-
 DR Congo
-
 Denmark
-
 Dominican Republic
-
 Ecuador
-
 Egypt
-
 El Salvador
-
 Estonia
-
 Eswatini
-
 Ethiopia
-
 Finland
-
 France
-
 Georgia
-
 Germany
-
 Ghana
-
 Greece
-
 Haiti
-
 Hong Kong
-
 Hungary
-
 India
-
 Indonesia
-
 Iran, Islamic republic
-
 Iraq
-
 Ireland
-
 Israel
-
 Italy
-
 Jamaica
-
 Japan
-
 Jordan
-
 Kazakhstan
-
 Kenya
-
 Korea
-
 Kuwait
-
 Kyrgyzstan
-
 Laos
-
 Latvia
-
 Lebanon
-
 Lesotho
-
 Libya
-
 Lithuania
-
 Luxembourg
-
 Madagascar
-
 Malaysia
-
 Malta
-
 Mauritius
-
 Mexico
-
 Moldova
-
 Mongolia
-
 Montenegro
-
 Morocco
-
 Mozambique
-
 Myanmar
-
 Namibia
-
 Nepal
-
 Netherlands
-
 New Zealand
-
 Nigeria
-
 North Macedonia
-
 Norway
-
 Oman
-
 Pakistan
-
 Palestine
-
 Panama
-
 Papua New Guinea
-
 Paraguay
-
 Peru
-
 Philippines
-
 Poland
-
 Portugal
-
 Puerto Rico
-
 Qatar
-
 Reunion
-
 Romania
-
 Rwanda
-
 Saudi Arabia
-
 Serbia
-
 Singapore
-
 Slovakia
-
 Slovenia
-
 Somalia
-
 South Africa
-
 Spain
-
 Sri Lanka
-
 Sweden
-
 Switzerland
-
 Syria
-
 Taiwan
-
 Tajikistan
-
 Tanzania
-
 Thailand
-
 Trinidad and Tobago
-
 Tunisia
-
 Turkey
-
 UAE
-
 Uganda
-
 Ukraine
-
 United Kingdom
-
United States
-
 Uruguay
-
 Uzbekistan
-
 Venezuela
-
 Vietnam
-
 Yemen
-
 Zambia
-
 Zimbabwe
- Forex
- Crypto












