

What's behind SNDL's latest 3.2% stock pullback?

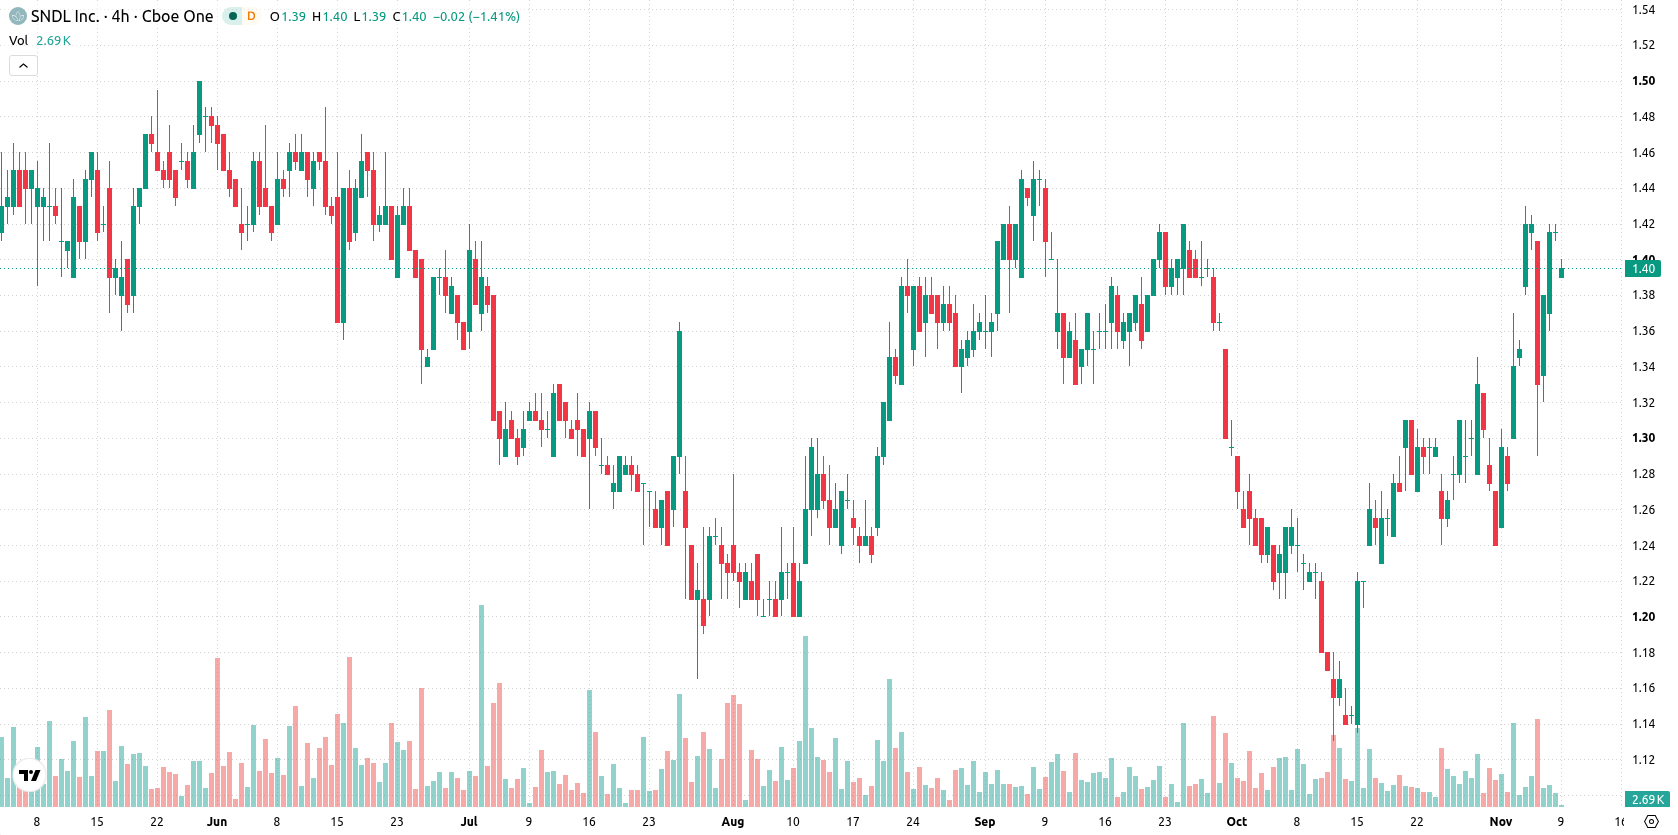
Technical momentum was the main driver behind SNDL Inc. (SNDL) falling 3.18% today, as both oscillators and session dynamics pointed to a cooling-off period. Despite buyer resilience and moderate short-term momentum, the pullback is limited by SNDL holding above its 20-day and 50-day moving averages but failing to clear longer-term resistance below the 200-day average.
 1.42
1.43
Highlights
- SNDL stock is trading above short- and medium-term averages but remains capped by long-term resistance at $1.39.
- Technical indicators show moderate momentum with multiple overbought signals, raising the risk of a short-term pullback.
- Expected range over the next five trading days is $1.31 to $1.44, with limited directional impulse near $1.36 to $1.39.
Upward bias persists as momentum remains moderate under resistance
SNDL is trading above both its 20-day and 50-day moving averages ($1.28 and $1.32), signaling positive short- and medium-term momentum. However, the stock remains below the 200-day moving average at $1.39, indicating lingering long-term resistance. Immediate support is seen at $1.36 with a near-term ceiling at $1.39. Momentum is moderate, with the MACD giving a buy signal and the ADX at 15.57, reflecting a lack of strong trend. RSI is neutral. Stochastic RSI and CCI readings are in their overbought zones, which increases the risk of a short-term pullback. Bull/Bear Power is above zero, suggesting intraday buyers have the edge, and the Awesome Oscillator supports the upward bias. SNDL last traded at $1.37, near the session low, following an opening downside gap and intraday volatility of 4.41%, with pressure noted after the open but some resilience from buyers observed.
Earlier, analysts noted that SNDL maintained an overall bullish technical outlook as long as key support levels held and upward momentum persisted. The current analysis adds a note of caution, with short-term overbought signals and long-term resistance highlighting $1.36 as a pivotal level for traders to monitor in the days ahead.









-
 Afghanistan
-
 Albania
-
 Algeria
-
 Angola
-
 Argentina
-
 Armenia
-
 Australia
-
 Austria
-
 Azerbaijan
-
 Bahamas
-
 Bahrain
-
 Bangladesh
-
 Belarus
-
 Belgium
-
 Bolivia
-
 Botswana
-
 Brazil
-
 Brunei
-
 Bulgaria
-
 Cambodia
-
 Cameroon
-
 Canada
-
 Chile
-
 China
-
 Colombia
-
 Congo
-
 Costa Rica
-
 Cote d'Ivoire
-
 Croatia
-
 Cuba
-
 Cyprus
-
 Czechia
-
 DR Congo
-
 Denmark
-
 Dominican Republic
-
 Ecuador
-
 Egypt
-
 El Salvador
-
 Estonia
-
 Eswatini
-
 Ethiopia
-
 Finland
-
 France
-
 Georgia
-
 Germany
-
 Ghana
-
 Greece
-
 Haiti
-
 Hong Kong
-
 Hungary
-
 India
-
 Indonesia
-
 Iran, Islamic republic
-
 Iraq
-
 Ireland
-
 Israel
-
 Italy
-
 Jamaica
-
 Japan
-
 Jordan
-
 Kazakhstan
-
 Kenya
-
 Korea
-
 Kuwait
-
 Kyrgyzstan
-
 Laos
-
 Latvia
-
 Lebanon
-
 Lesotho
-
 Libya
-
 Lithuania
-
 Luxembourg
-
 Madagascar
-
 Malaysia
-
 Malta
-
 Mauritius
-
 Mexico
-
 Moldova
-
 Mongolia
-
 Montenegro
-
 Morocco
-
 Mozambique
-
 Myanmar
-
 Namibia
-
 Nepal
-
 Netherlands
-
 New Zealand
-
 Nigeria
-
 North Macedonia
-
 Norway
-
 Oman
-
 Pakistan
-
 Palestine
-
 Panama
-
 Papua New Guinea
-
 Paraguay
-
 Peru
-
 Philippines
-
 Poland
-
 Portugal
-
 Puerto Rico
-
 Qatar
-
 Reunion
-
 Romania
-
 Rwanda
-
 Saudi Arabia
-
 Serbia
-
 Singapore
-
 Slovakia
-
 Slovenia
-
 Somalia
-
 South Africa
-
 Spain
-
 Sri Lanka
-
 Sweden
-
 Switzerland
-
 Syria
-
 Taiwan
-
 Tajikistan
-
 Tanzania
-
 Thailand
-
 Trinidad and Tobago
-
 Tunisia
-
 Turkey
-
 UAE
-
 Uganda
-
 Ukraine
-
 United Kingdom
-
United States
-
 Uruguay
-
 Uzbekistan
-
 Venezuela
-
 Vietnam
-
 Yemen
-
 Zambia
-
 Zimbabwe
- Forex
- Crypto












