

SNDL stock slips as weak momentum persists below the 200-day moving average

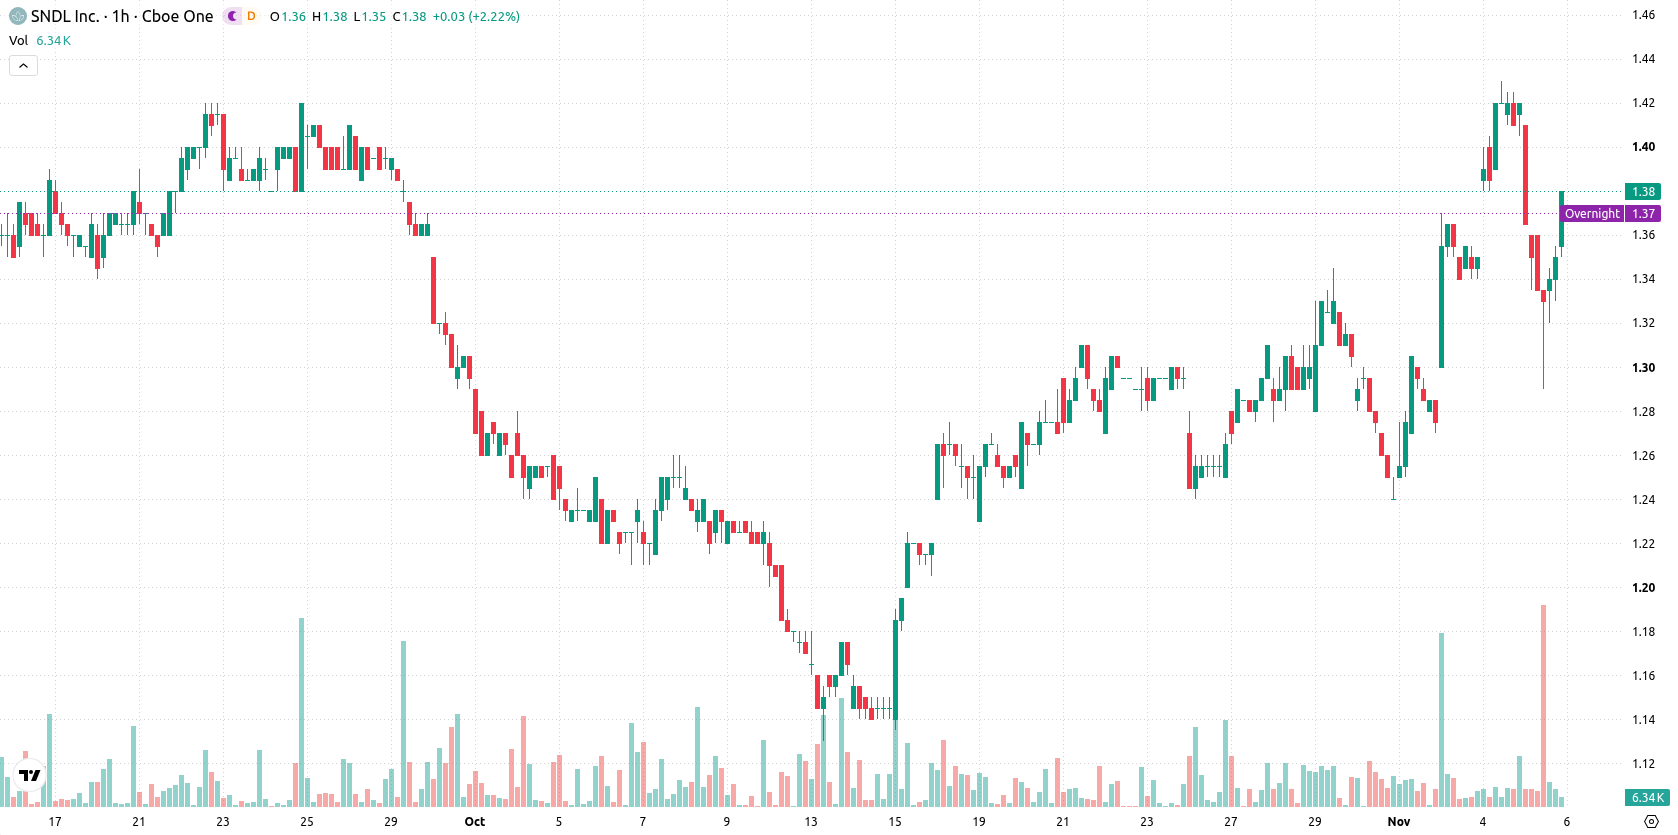
SNDL (SNDL) stock is trading at $1.38, down 2.83% for the session. The price currently sits above its short- and medium-term moving averages, while remaining below long-term trend levels.
 1.42
1.43
Highlights
- SNDL stock closed at $1.38, slipping 2.83% for the session with high volatility and persistent buyer interest near the daily high.
- Short- and medium-term technical signals show upside momentum, but the long-term trend remains under bearish pressure.
- The expected trading range is $1.30 to $1.46, with high probability of consolidation or potential breakout above resistance.
Bullish momentum with mixed indicators as intraday support holds
Price action on SNDL shows that it is trading above its MA-20 and MA-50 on the hourly chart, while staying below the MA-200 on the daily timeframe. The Ichimoku Kijun level at $1.35 is acting as immediate support. MACD and ADX are both signaling bullish momentum, whereas RSI, Stoch RSI, and CCI remain neutral. Bull/Bear Power is marginally positive, reflecting slight buyer dominance intraday. Price remains close to today's high despite a volatile pullback, and there is a modest gap from the previous close. Mixed readings from oscillators and momentum indicators highlight indecision in the current setup.
Range-bound trade likely as upside bias emerges
In the short term, SNDL is likely to consolidate between $1.30 and $1.46, with a very high probability of an upward move and a very low chance of further decline. The baseline scenario calls for continued range trading within this band. A breakout above $1.46 would trigger renewed buying, while a drop below support at $1.35 could encourage sellers toward the lower boundary near $1.30.
Earlier, analysts noted that SNDL’s technical setup showed mixed momentum and lingering downside risks despite short-term buyer support. The latest data reinforces this indecisive landscape, making the $1.35 Ichimoku Kijun level a critical pivot to monitor for any directional breakout.









-
 Afghanistan
-
 Albania
-
 Algeria
-
 Angola
-
 Argentina
-
 Armenia
-
 Australia
-
 Austria
-
 Azerbaijan
-
 Bahamas
-
 Bahrain
-
 Bangladesh
-
 Belarus
-
 Belgium
-
 Bolivia
-
 Botswana
-
 Brazil
-
 Brunei
-
 Bulgaria
-
 Cambodia
-
 Cameroon
-
 Canada
-
 Chile
-
 China
-
 Colombia
-
 Congo
-
 Costa Rica
-
 Cote d'Ivoire
-
 Croatia
-
 Cuba
-
 Cyprus
-
 Czechia
-
 DR Congo
-
 Denmark
-
 Dominican Republic
-
 Ecuador
-
 Egypt
-
 El Salvador
-
 Estonia
-
 Eswatini
-
 Ethiopia
-
 Finland
-
 France
-
 Georgia
-
 Germany
-
 Ghana
-
 Greece
-
 Haiti
-
 Hong Kong
-
 Hungary
-
 India
-
 Indonesia
-
 Iran, Islamic republic
-
 Iraq
-
 Ireland
-
 Israel
-
 Italy
-
 Jamaica
-
 Japan
-
 Jordan
-
 Kazakhstan
-
 Kenya
-
 Korea
-
 Kuwait
-
 Kyrgyzstan
-
 Laos
-
 Latvia
-
 Lebanon
-
 Lesotho
-
 Libya
-
 Lithuania
-
 Luxembourg
-
 Madagascar
-
 Malaysia
-
 Malta
-
 Mauritius
-
 Mexico
-
 Moldova
-
 Mongolia
-
 Montenegro
-
 Morocco
-
 Mozambique
-
 Myanmar
-
 Namibia
-
 Nepal
-
 Netherlands
-
 New Zealand
-
 Nigeria
-
 North Macedonia
-
 Norway
-
 Oman
-
 Pakistan
-
 Palestine
-
 Panama
-
 Papua New Guinea
-
 Paraguay
-
 Peru
-
 Philippines
-
 Poland
-
 Portugal
-
 Puerto Rico
-
 Qatar
-
 Reunion
-
 Romania
-
 Rwanda
-
 Saudi Arabia
-
 Serbia
-
 Singapore
-
 Slovakia
-
 Slovenia
-
 Somalia
-
 South Africa
-
 Spain
-
 Sri Lanka
-
 Sweden
-
 Switzerland
-
 Syria
-
 Taiwan
-
 Tajikistan
-
 Tanzania
-
 Thailand
-
 Trinidad and Tobago
-
 Tunisia
-
 Turkey
-
 UAE
-
 Uganda
-
 Ukraine
-
 United Kingdom
-
United States
-
 Uruguay
-
 Uzbekistan
-
 Venezuela
-
 Vietnam
-
 Yemen
-
 Zambia
-
 Zimbabwe
- Forex
- Crypto












