

Will SNDL stock break out higher as bullish signals support the current uptrend?

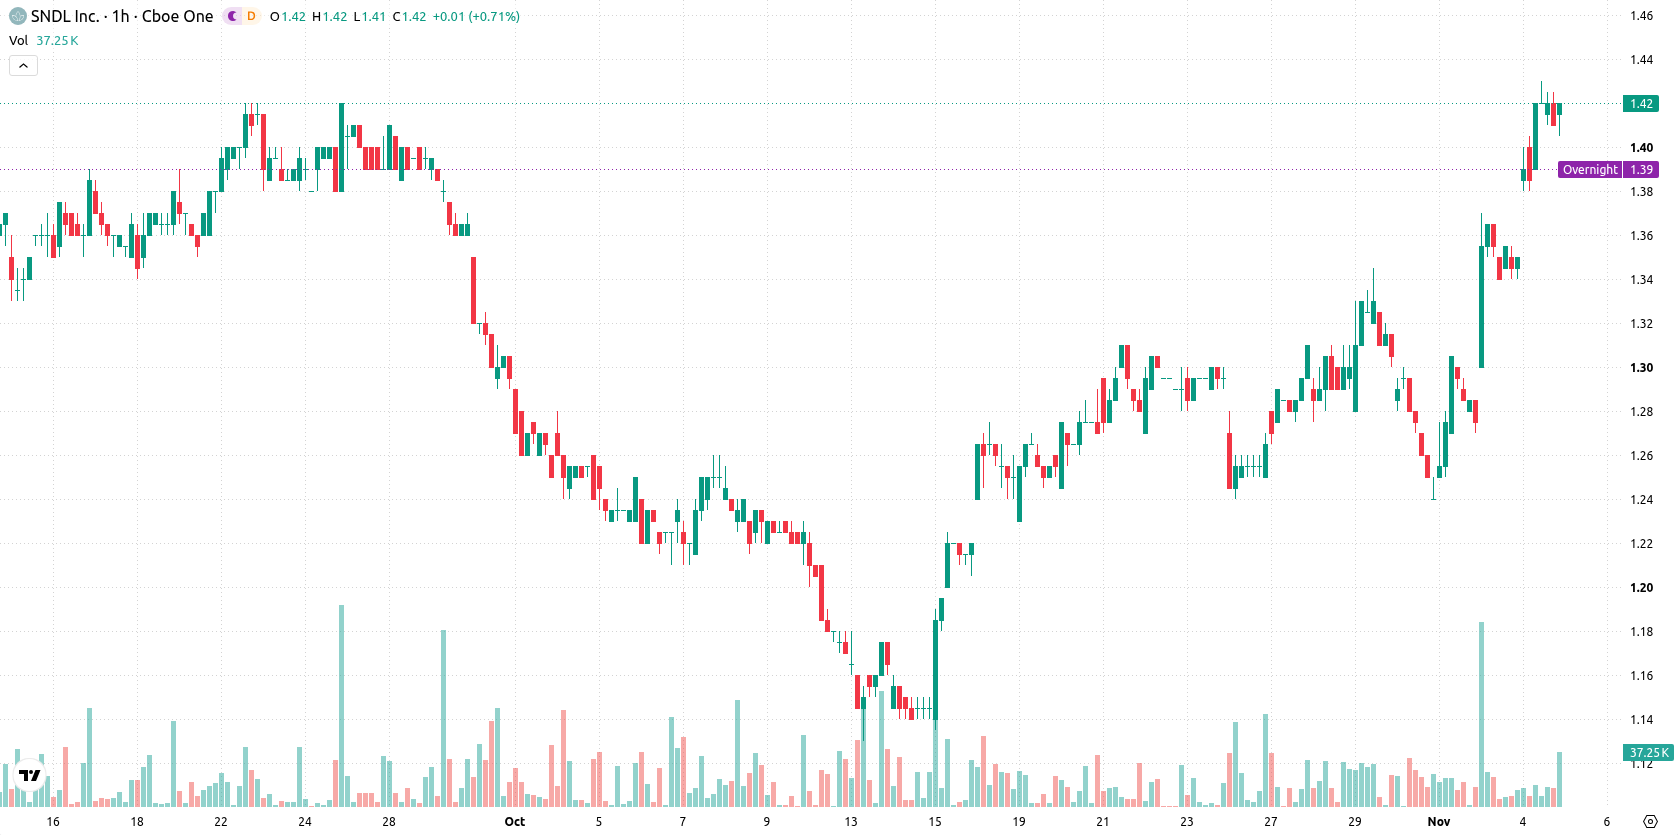
SNDL Inc. (SNDL) stock is trading at $1.41, up 4.44% on the day with a gap higher at the open. The share price currently sits above its key moving averages and is in the middle of its intraday range amid moderate volatility.
 1.42
1.43
Highlights
- SNDL stock trades above key short-, medium-, and long-term moving averages, confirming broad bullish momentum.
- MACD and ADX both show firm buy momentum, while oscillators remain balanced and indicate the advance is not overextended.
- Intraday price is $1.41, in a projected 2 to 3 day range of $1.33 to $1.49, with $1.34 as critical support.
Buyer signals with neutral momentum as prices clear key averages
On the technical front, SNDL is trading above the MA-20 and MA-50 on the hourly chart, as well as above the MA-200 on the daily timeframe. The Ichimoku Kijun at $1.34 acts as immediate support. MACD and ADX are both on buy signals, while readings for RSI, Stoch RSI, and CCI remain neutral and away from extreme territory. Bull/Bear Power stands slightly positive at 0.04, highlighting mild buyer dominance intraday. The Awesome Oscillator is neutral and does not provide further directional confirmation.
Bullish consolidation favored as upside bias tempers downside risk
Looking ahead, SNDL is likely to trade within the $1.33 to $1.49 range over the next 2–3 days, with a very high probability of continued upside and limited downside risk. The baseline scenario anticipates consolidation within this corridor. If price surges and holds above resistance near $1.49, a bullish breakout could follow, while a move below the Ichimoku Kijun support at $1.34 would introduce the first sign of vulnerability.
Earlier, analysts noted that SNDL was exhibiting mixed technical signals with buyers and sellers contending for direction. The current setup provides added confirmation of mild buyer dominance and suggests traders should watch for a potential breakout on sustained strength above $1.49.









-
 Afghanistan
-
 Albania
-
 Algeria
-
 Angola
-
 Argentina
-
 Armenia
-
 Australia
-
 Austria
-
 Azerbaijan
-
 Bahamas
-
 Bahrain
-
 Bangladesh
-
 Belarus
-
 Belgium
-
 Bolivia
-
 Botswana
-
 Brazil
-
 Brunei
-
 Bulgaria
-
 Cambodia
-
 Cameroon
-
 Canada
-
 Chile
-
 China
-
 Colombia
-
 Congo
-
 Costa Rica
-
 Cote d'Ivoire
-
 Croatia
-
 Cuba
-
 Cyprus
-
 Czechia
-
 DR Congo
-
 Denmark
-
 Dominican Republic
-
 Ecuador
-
 Egypt
-
 El Salvador
-
 Estonia
-
 Eswatini
-
 Ethiopia
-
 Finland
-
 France
-
 Georgia
-
 Germany
-
 Ghana
-
 Greece
-
 Haiti
-
 Hong Kong
-
 Hungary
-
 India
-
 Indonesia
-
 Iran, Islamic republic
-
 Iraq
-
 Ireland
-
 Israel
-
 Italy
-
 Jamaica
-
 Japan
-
 Jordan
-
 Kazakhstan
-
 Kenya
-
 Korea
-
 Kuwait
-
 Kyrgyzstan
-
 Laos
-
 Latvia
-
 Lebanon
-
 Lesotho
-
 Libya
-
 Lithuania
-
 Luxembourg
-
 Madagascar
-
 Malaysia
-
 Malta
-
 Mauritius
-
 Mexico
-
 Moldova
-
 Mongolia
-
 Montenegro
-
 Morocco
-
 Mozambique
-
 Myanmar
-
 Namibia
-
 Nepal
-
 Netherlands
-
 New Zealand
-
 Nigeria
-
 North Macedonia
-
 Norway
-
 Oman
-
 Pakistan
-
 Palestine
-
 Panama
-
 Papua New Guinea
-
 Paraguay
-
 Peru
-
 Philippines
-
 Poland
-
 Portugal
-
 Puerto Rico
-
 Qatar
-
 Reunion
-
 Romania
-
 Rwanda
-
 Saudi Arabia
-
 Serbia
-
 Singapore
-
 Slovakia
-
 Slovenia
-
 Somalia
-
 South Africa
-
 Spain
-
 Sri Lanka
-
 Sweden
-
 Switzerland
-
 Syria
-
 Taiwan
-
 Tajikistan
-
 Tanzania
-
 Thailand
-
 Trinidad and Tobago
-
 Tunisia
-
 Turkey
-
 UAE
-
 Uganda
-
 Ukraine
-
 United Kingdom
-
United States
-
 Uruguay
-
 Uzbekistan
-
 Venezuela
-
 Vietnam
-
 Yemen
-
 Zambia
-
 Zimbabwe
- Forex
- Crypto












