


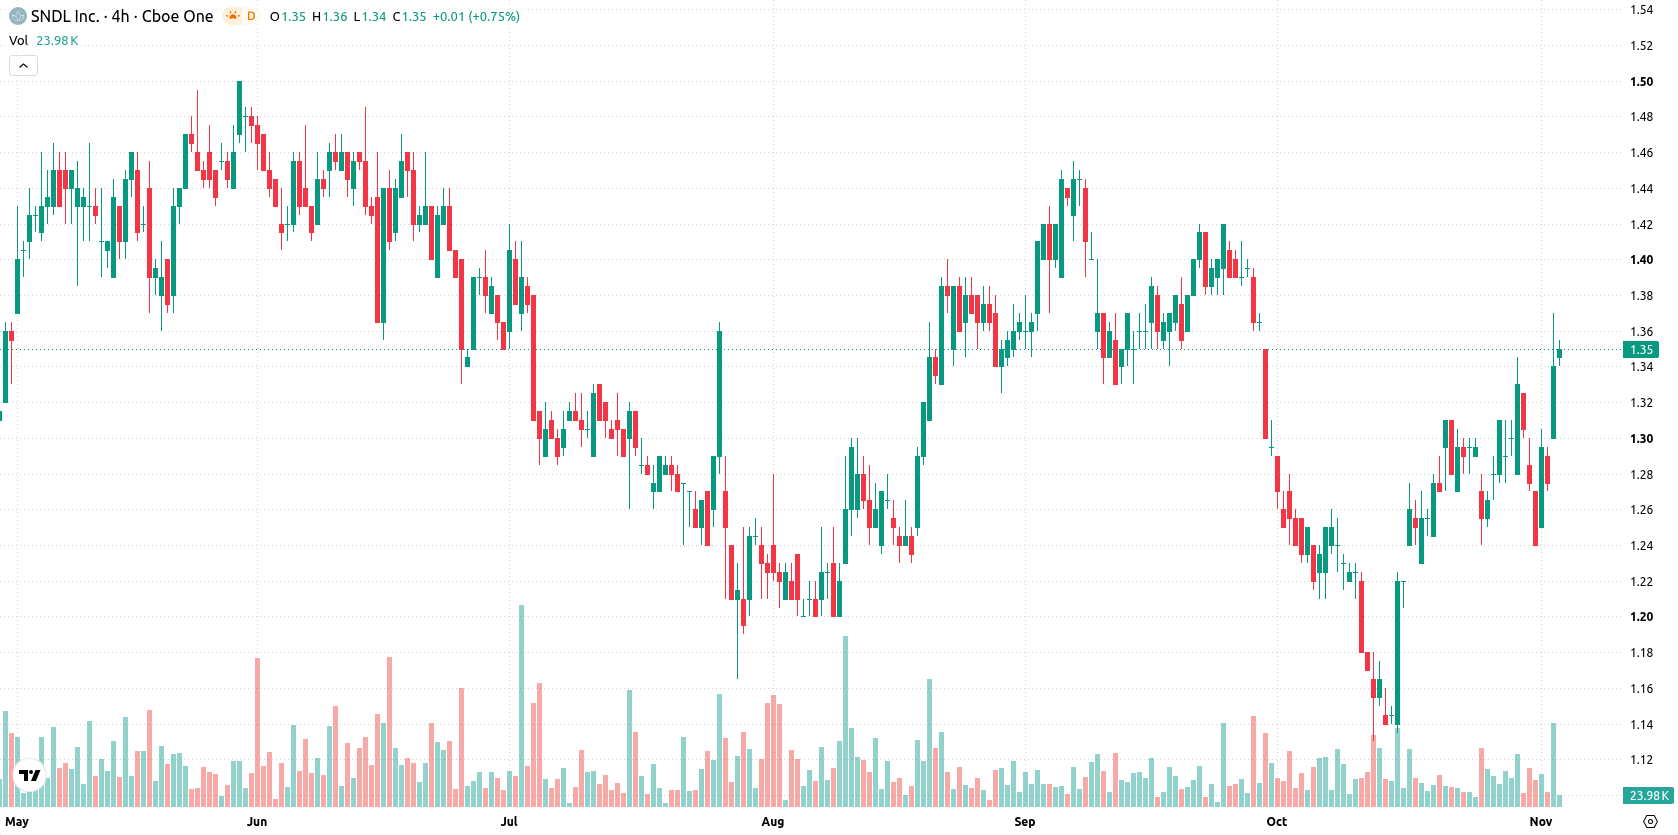
SNDL Inc. (SNDL) advanced 3.35% today as strong momentum across all technical timeframes fueled buying interest. The rise is supported by SNDL trading above its 20-day, 50-day, and 200-day moving averages, reinforcing the underlying bullish tone.
 1.42
1.43
Highlights
- SNDL stock is trading above its 20-day, 50-day, and 200-day averages, showing sustained positive momentum across timeframes.
- Oscillator signals are mixed, with Stochastic RSI and CCI overbought, BBP and Awesome Oscillator bullish, and MACD and ADX neutral.
- Price is at $1.39 near the day high, with a 5-day expected range of $1.33 to $1.45 and a 75% probability of moving higher.
Bullish technical stance as mixed momentum signals flag risks
SNDL is trading above its 20-day, 50-day, and 200-day moving averages ($1.25, $1.32, and $1.39), signaling robust momentum across short-, medium-, and long-term trends. Near-term resistance stands at $1.45, while support is observed at the $1.36 level. Momentum signals remain mixed; the Relative Strength Index (RSI) is neutral, whereas both the Stochastic RSI and Commodity Channel Index (CCI) are in the overbought zone, suggesting some risk of short-term overheating. The ADX and MACD indicate neutral momentum, and Bull/Bear Power (BBP) plus the Awesome Oscillator favor buyers, reflecting intraday bullish dominance.
Earlier, analysts noted that SNDL was experiencing mixed technical signals, with expectations of continued sideways movement as buyers and sellers contended for direction. The latest momentum shift strengthens this view, with the current setup underscoring $1.45 as a decisive level for potential breakout in the near term.









-
 Afghanistan
-
 Albania
-
 Algeria
-
 Angola
-
 Argentina
-
 Armenia
-
 Australia
-
 Austria
-
 Azerbaijan
-
 Bahamas
-
 Bahrain
-
 Bangladesh
-
 Belarus
-
 Belgium
-
 Bolivia
-
 Botswana
-
 Brazil
-
 Brunei
-
 Bulgaria
-
 Cambodia
-
 Cameroon
-
 Canada
-
 Chile
-
 China
-
 Colombia
-
 Congo
-
 Costa Rica
-
 Cote d'Ivoire
-
 Croatia
-
 Cuba
-
 Cyprus
-
 Czechia
-
 DR Congo
-
 Denmark
-
 Dominican Republic
-
 Ecuador
-
 Egypt
-
 El Salvador
-
 Estonia
-
 Eswatini
-
 Ethiopia
-
 Finland
-
 France
-
 Georgia
-
 Germany
-
 Ghana
-
 Greece
-
 Haiti
-
 Hong Kong
-
 Hungary
-
 India
-
 Indonesia
-
 Iran, Islamic republic
-
 Iraq
-
 Ireland
-
 Israel
-
 Italy
-
 Jamaica
-
 Japan
-
 Jordan
-
 Kazakhstan
-
 Kenya
-
 Korea
-
 Kuwait
-
 Kyrgyzstan
-
 Laos
-
 Latvia
-
 Lebanon
-
 Lesotho
-
 Libya
-
 Lithuania
-
 Luxembourg
-
 Madagascar
-
 Malaysia
-
 Malta
-
 Mauritius
-
 Mexico
-
 Moldova
-
 Mongolia
-
 Montenegro
-
 Morocco
-
 Mozambique
-
 Myanmar
-
 Namibia
-
 Nepal
-
 Netherlands
-
 New Zealand
-
 Nigeria
-
 North Macedonia
-
 Norway
-
 Oman
-
 Pakistan
-
 Palestine
-
 Panama
-
 Papua New Guinea
-
 Paraguay
-
 Peru
-
 Philippines
-
 Poland
-
 Portugal
-
 Puerto Rico
-
 Qatar
-
 Reunion
-
 Romania
-
 Rwanda
-
 Saudi Arabia
-
 Serbia
-
 Singapore
-
 Slovakia
-
 Slovenia
-
 Somalia
-
 South Africa
-
 Spain
-
 Sri Lanka
-
 Sweden
-
 Switzerland
-
 Syria
-
 Taiwan
-
 Tajikistan
-
 Tanzania
-
 Thailand
-
 Trinidad and Tobago
-
 Tunisia
-
 Turkey
-
 UAE
-
 Uganda
-
 Ukraine
-
 United Kingdom
-
United States
-
 Uruguay
-
 Uzbekistan
-
 Venezuela
-
 Vietnam
-
 Yemen
-
 Zambia
-
 Zimbabwe
- Forex
- Crypto












