


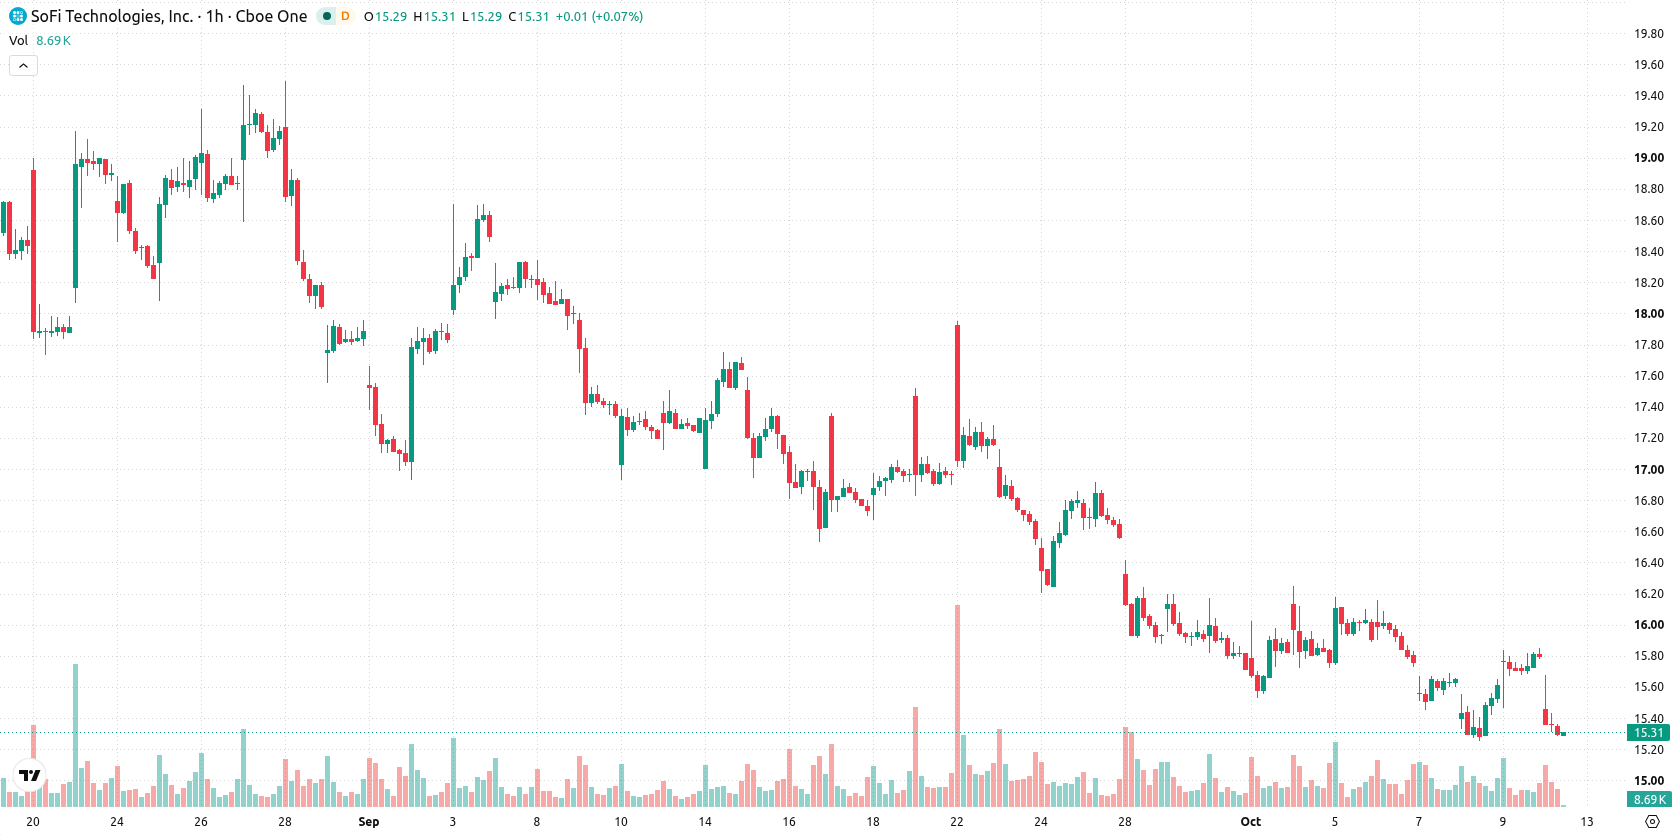
SoFi (SOFI) stock is trading at $15.29, marking a decline of 3.29% today. The price sits below its short- and longer-term moving averages, highlighting continued selling interest.
 15.66
16.09
15.66
16.09
Highlights
- SoFi Technologies migrated its entire card program to blockchain-based settlement with SoFiUSD over Mastercard, targeting more than $25 billion in annualized transaction volume.
- The company partnered with Orbi and Mastercard to offer a crypto-linked card in Mexico for real-time fiat and crypto payments.
- Shares of SoFi trade below key moving averages with expected sideways movement between $14.92 and $15.66 and a high probability of further decline.
Blockchain settlement and international card launch offset by persistent selling
SoFi Technologies became the first national bank to fully migrate its entire card program to blockchain-based settlement using its proprietary stablecoin SoFiUSD across Mastercard’s global payments network, a significant move reported by Investing.com that is expected to process over $25 billion in annualized transaction volume. This integration is designed to improve the efficiency and scalability of SoFi Bank's payments, reinforcing the company's reputation as an early innovator in the fintech sector. Additionally, SoFi partnered with Mexican fintech Orbi and Mastercard to launch a crypto-linked card in Mexico, enabling real-time fiat and crypto spending and expanding SoFi’s reach in international payment solutions, though price action has remained under broader selling pressure.
Mixed momentum as technicals show resistance and exhaustion risk
On the technical front, SOFI is trading below the MA-20 and MA-50 on the H1 chart, as well as under the MA-200 on the daily timeframe. The Ichimoku Kijun at $15.64 marks immediate resistance, with support at $14.92 offering a short-term floor. MACD and ADX remain neutral, while RSI points to a Buy but is contradicted by overbought readings on both Stoch RSI and CCI, indicating a potential for near-term exhaustion. Bull/Bear Power reflects intraday buyer dominance even as the broader trend shows weakness and momentum signals are mixed.
Downside risk dominates as SOFI faces volatile trading range
Over the next several days, SOFI is expected to oscillate within a volatile range of $14.92 to $15.66, with a very high probability of downward movement and a low chance of a rebound. The base case anticipates sideways consolidation within this range. A bullish scenario could emerge only if the stock decisively clears resistance at $15.64, while a break below $14.92 would open the door to further declines.
Earlier, analysts noted that persistent technical weakness and ongoing downside risk continued to weigh on SoFi despite its ongoing product and partnership expansions. The current analysis affirms this bearish outlook, with mixed momentum signals and volatility risks suggesting traders should closely monitor the $14.92 support level for an early warning of further downside.











-
 Afghanistan
-
 Albania
-
 Algeria
-
 Angola
-
 Argentina
-
 Armenia
-
 Australia
-
 Austria
-
 Azerbaijan
-
 Bahamas
-
 Bahrain
-
 Bangladesh
-
 Belarus
-
 Belgium
-
 Bolivia
-
 Botswana
-
 Brazil
-
 Brunei
-
 Bulgaria
-
 Cambodia
-
 Cameroon
-
 Canada
-
 Chile
Chile
-
 China
China
-
 Colombia
-
 Congo
Congo
-
 Costa Rica
-
 Cote d'Ivoire
-
 Croatia
-
 Cuba
Cuba
-
 Cyprus
-
 Czechia
-
 DR Congo
-
 Denmark
-
 Dominican Republic
-
 Ecuador
-
 Egypt
Egypt
-
 El Salvador
-
 Estonia
-
 Eswatini
-
 Ethiopia
-
 Finland
-
 France
-
 Georgia
-
 Germany
-
 Ghana
Ghana
-
 Greece
-
 Haiti
Haiti
-
 Hong Kong
-
 Hungary
-
 India
India
-
 Indonesia
-
 Iran, Islamic republic
-
 Iraq
Iraq
-
 Ireland
-
 Israel
-
 Italy
Italy
-
 Jamaica
-
 Japan
Japan
-
 Jordan
-
 Kazakhstan
-
 Kenya
Kenya
-
 Korea
Korea
-
 Kuwait
-
 Kyrgyzstan
-
 Laos
Laos
-
 Latvia
-
 Lebanon
-
 Lesotho
-
 Libya
Libya
-
 Lithuania
-
 Luxembourg
-
 Madagascar
-
 Malaysia
-
 Malta
Malta
-
 Mauritius
-
 Mexico
-
 Moldova
-
 Mongolia
-
 Montenegro
-
 Morocco
-
 Mozambique
-
 Myanmar
-
 Namibia
-
 Nepal
Nepal
-
 Netherlands
-
 New Zealand
-
 Nigeria
-
 North Macedonia
-
 Norway
-
 Oman
Oman
-
 Pakistan
-
 Palestine
-
 Panama
-
 Papua New Guinea
-
 Paraguay
-
 Peru
Peru
-
 Philippines
-
 Poland
-
 Portugal
-
 Puerto Rico
-
 Qatar
Qatar
-
 Reunion
-
 Romania
-
 Rwanda
-
 Saudi Arabia
-
 Serbia
-
 Singapore
-
 Slovakia
-
 Slovenia
-
 Somalia
-
 South Africa
-
 Spain
Spain
-
 Sri Lanka
-
 Sweden
-
 Switzerland
-
 Syria
Syria
-
 Taiwan
-
 Tajikistan
-
 Tanzania
-
 Thailand
-
 Trinidad and Tobago
-
 Tunisia
-
 Turkey
-
 UAE
UAE
-
 Uganda
-
 Ukraine
-
 United Kingdom
-
United States
-
 Uruguay
-
 Uzbekistan
-
 Venezuela
-
 Vietnam
-
 Yemen
Yemen
-
 Zambia
-
 Zimbabwe
- Forex
- Crypto












