


SoFi (SOFI) stock is trading at $15.89, down 8.6% on the day. The price sits below its key short-, medium-, and long-term moving averages, indicating a prevailing downside bias versus historical trend levels.
 16.43
17.72
Highlights
- SoFi Technologies reported third quarter adjusted net revenue of $1.371 billion, up 44% year over year, and net income of $241 million.
- The company added 1.2 million new members, bringing total membership to 17.1 million and reinforcing its user growth trajectory.
- Shares of SoFi stock trade below key moving averages with a bearish short and long-term structure, and price is expected to consolidate in the $15.31 to $16.47 range with a higher probability of downside.
Robust earnings and membership growth as stock faces selling pressure
SoFi Technologies reported strong third quarter 2026 results on October 27, 2026, including a 44% year-over-year increase in adjusted net revenue to $1.371 billion, net income of $241 million, and the addition of 1.2 million new members, raising total membership to 17.1 million. These figures point to more robust earnings capacity and continued user growth, which typically supports improved investor sentiment. The company also granted 15,880 restricted stock units to director John C.R. Hele on October 19, 2026, aligning executive interests with shareholders, though price action has remained under broader selling pressure.
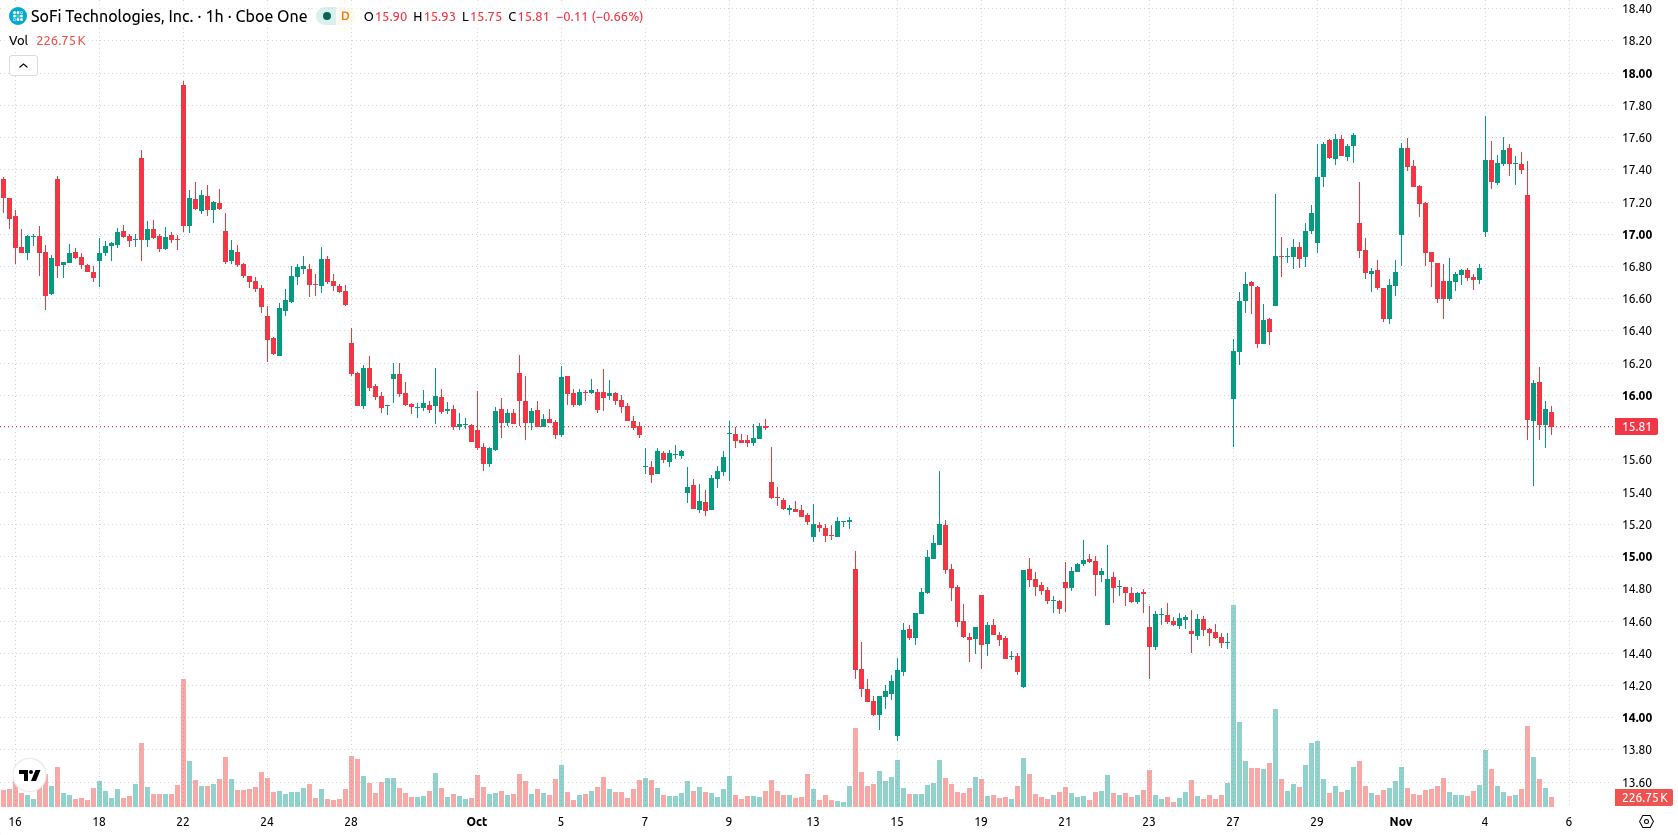
Moving average resistance and mixed momentum as volatility spikes
SOFI is trading below its MA-20, MA-50, and MA-200, with the Ichimoku Kijun level at $17.02 acting as immediate resistance. The MACD points to strong buy momentum, while the ADX suggests a sell bias, revealing divergence in trend strength indicators. The RSI and CCI are neutral, and Stoch RSI is oversold, indicating possible exhaustion of recent selling and potential for a technical rebound. Bull/Bear Power reads positive at 0.35, showing some intraday buying support despite price closing near the session low following high volatility and an 8.6% decline. Awesome Oscillator is neutral, reflecting a mixed momentum and oscillator environment.
Range-bound outlook prevails given high downside risk
In the short term, SOFI is expected to consolidate between $15.31 and $16.47, a volatility band relative to current levels. Scenario probabilities suggest a 32% chance of an upward move and 68% for further downside. A breakout above $17.02 would be needed for a bullish shift, while sustained losses below $15.31 would signal deeper declines. The baseline expectation is for the price to remain range-bound until a clear breakout direction emerges.
Previously it was reported that SoFi shares were exhibiting range-bound behavior amid mixed technical signals and ongoing selling pressure, despite strong business results. The current analysis indicates that downside risks remain prominent, with $15.31 emerging as a critical level for traders to monitor for signs of further weakness or a potential reversal.










-
 Afghanistan
-
 Albania
-
 Algeria
-
 Angola
-
 Argentina
-
 Armenia
-
 Australia
-
 Austria
-
 Azerbaijan
-
 Bahamas
-
 Bahrain
-
 Bangladesh
-
 Belarus
-
 Belgium
-
 Bolivia
-
 Botswana
-
 Brazil
-
 Brunei
-
 Bulgaria
-
 Cambodia
-
 Cameroon
-
 Canada
-
 Chile
-
 China
-
 Colombia
-
 Congo
-
 Costa Rica
-
 Cote d'Ivoire
-
 Croatia
-
 Cuba
-
 Cyprus
-
 Czechia
-
 DR Congo
-
 Denmark
-
 Dominican Republic
-
 Ecuador
-
 Egypt
-
 El Salvador
-
 Estonia
-
 Eswatini
-
 Ethiopia
-
 Finland
-
 France
-
 Georgia
-
 Germany
-
 Ghana
-
 Greece
-
 Haiti
-
 Hong Kong
-
 Hungary
-
 India
-
 Indonesia
-
 Iran, Islamic republic
-
 Iraq
-
 Ireland
-
 Israel
-
 Italy
-
 Jamaica
-
 Japan
-
 Jordan
-
 Kazakhstan
-
 Kenya
-
 Korea
-
 Kuwait
-
 Kyrgyzstan
-
 Laos
-
 Latvia
-
 Lebanon
-
 Lesotho
-
 Libya
-
 Lithuania
-
 Luxembourg
-
 Madagascar
-
 Malaysia
-
 Malta
-
 Mauritius
-
 Mexico
-
 Moldova
-
 Mongolia
-
 Montenegro
-
 Morocco
-
 Mozambique
-
 Myanmar
-
 Namibia
-
 Nepal
-
 Netherlands
-
 New Zealand
-
 Nigeria
-
 North Macedonia
-
 Norway
-
 Oman
-
 Pakistan
-
 Palestine
-
 Panama
-
 Papua New Guinea
-
 Paraguay
-
 Peru
-
 Philippines
-
 Poland
-
 Portugal
-
 Puerto Rico
-
 Qatar
-
 Reunion
-
 Romania
-
 Rwanda
-
 Saudi Arabia
-
 Serbia
-
 Singapore
-
 Slovakia
-
 Slovenia
-
 Somalia
-
 South Africa
-
 Spain
-
 Sri Lanka
-
 Sweden
-
 Switzerland
-
 Syria
-
 Taiwan
-
 Tajikistan
-
 Tanzania
-
 Thailand
-
 Trinidad and Tobago
-
 Tunisia
-
 Turkey
-
 UAE
-
 Uganda
-
 Ukraine
-
 United Kingdom
-
United States
-
 Uruguay
-
 Uzbekistan
-
 Venezuela
-
 Vietnam
-
 Yemen
-
 Zambia
-
 Zimbabwe
- Forex
- Crypto












