

What's behind Hewlett Packard Enterprise's latest 4.4% stock pullback?

Hewlett Packard Enterprise Company (HPE) fell 4.41% as overbought technical readings triggered a wave of selling pressure on the day. The decline is reinforced by heavy intraday downside momentum and the stock's retreat from resistance near $72.61.
 72.29
73.55
72.29
73.55
Highlights
- Hewlett Packard Enterprise stock is firmly above its 20-day, 50-day, and 200-day moving averages, confirming strong upward price momentum.
- Multiple technical oscillators indicate overbought conditions, with downside pressure after a 4.41% intraday decline and high volatility at 4.82%.
- Hewlett Packard Enterprise stock is projected to trade in the $67.33 to $72.61 range over the next five days, with a 78% probability of moving higher.
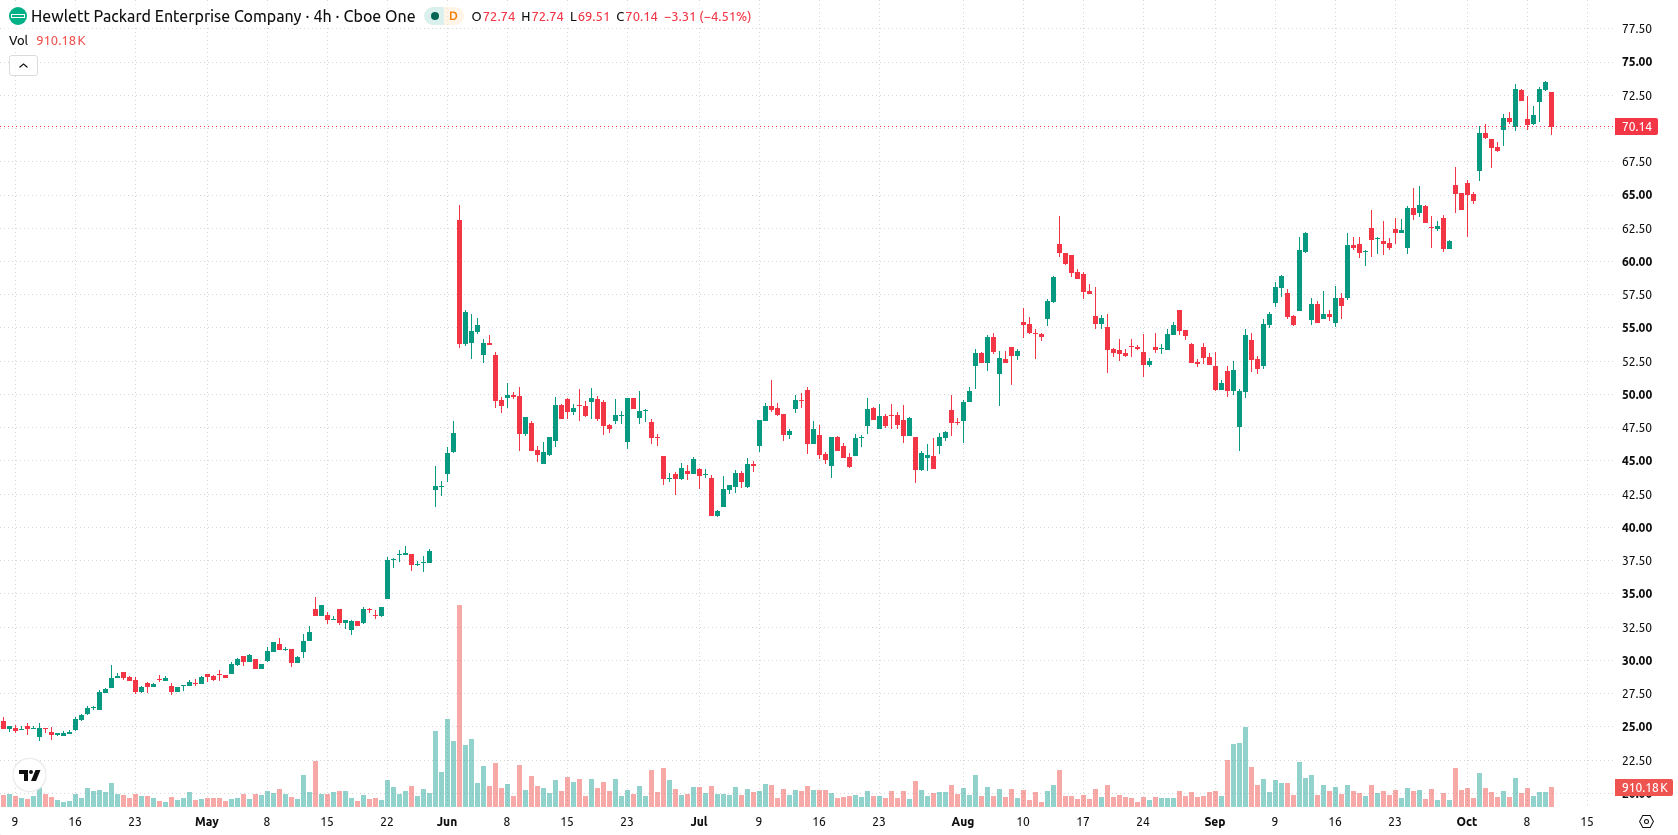
Uptrend persists as momentum flags clash with overbought stress
Hewlett Packard Enterprise is positioned above its 20-day ($63.94), 50-day ($58.17), and 200-day ($38.07) moving averages, confirming a robust uptrend across all time frames. However, the stock is struggling to hold above near-term support at $69.55, with immediate resistance at $72.61 capping upward moves. Momentum signals remain strongly positive, as the MACD and ADX both issue buy signals, while the RSI at 71.28, Stochastic RSI at 98, and CCI at 142.72 indicate overbought conditions. The Bull/Bear Power (BBP) at 6.22 signals heavy buying, yet also highlights an overextended state, and the Awesome Oscillator continues to support the broader bullish trend. Intraday volatility is elevated at 4.82%, and the stock is trading near its session low after a downside gap.
Earlier, analysts noted that Hewlett Packard Enterprise demonstrated strong technical momentum and was benefiting from growing demand in key technology sectors. The current pullback underscores the risk of short-term corrections in overextended conditions, with traders advised to monitor the $69.55 support as a potential pivot for near-term price direction.











-
 Afghanistan
-
 Albania
-
 Algeria
-
 Angola
-
 Argentina
-
 Armenia
-
 Australia
-
 Austria
-
 Azerbaijan
-
 Bahamas
-
 Bahrain
-
 Bangladesh
-
 Belarus
-
 Belgium
-
 Bolivia
-
 Botswana
-
 Brazil
-
 Brunei
-
 Bulgaria
-
 Cambodia
-
 Cameroon
-
 Canada
-
 Chile
Chile
-
 China
China
-
 Colombia
-
 Congo
Congo
-
 Costa Rica
-
 Cote d'Ivoire
-
 Croatia
-
 Cuba
Cuba
-
 Cyprus
-
 Czechia
-
 DR Congo
-
 Denmark
-
 Dominican Republic
-
 Ecuador
-
 Egypt
Egypt
-
 El Salvador
-
 Estonia
-
 Eswatini
-
 Ethiopia
-
 Finland
-
 France
-
 Georgia
-
 Germany
-
 Ghana
Ghana
-
 Greece
-
 Haiti
Haiti
-
 Hong Kong
-
 Hungary
-
 India
India
-
 Indonesia
-
 Iran, Islamic republic
-
 Iraq
Iraq
-
 Ireland
-
 Israel
-
 Italy
Italy
-
 Jamaica
-
 Japan
Japan
-
 Jordan
-
 Kazakhstan
-
 Kenya
Kenya
-
 Korea
Korea
-
 Kuwait
-
 Kyrgyzstan
-
 Laos
Laos
-
 Latvia
-
 Lebanon
-
 Lesotho
-
 Libya
Libya
-
 Lithuania
-
 Luxembourg
-
 Madagascar
-
 Malaysia
-
 Malta
Malta
-
 Mauritius
-
 Mexico
-
 Moldova
-
 Mongolia
-
 Montenegro
-
 Morocco
-
 Mozambique
-
 Myanmar
-
 Namibia
-
 Nepal
Nepal
-
 Netherlands
-
 New Zealand
-
 Nigeria
-
 North Macedonia
-
 Norway
-
 Oman
Oman
-
 Pakistan
-
 Palestine
-
 Panama
-
 Papua New Guinea
-
 Paraguay
-
 Peru
Peru
-
 Philippines
-
 Poland
-
 Portugal
-
 Puerto Rico
-
 Qatar
Qatar
-
 Reunion
-
 Romania
-
 Rwanda
-
 Saudi Arabia
-
 Serbia
-
 Singapore
-
 Slovakia
-
 Slovenia
-
 Somalia
-
 South Africa
-
 Spain
Spain
-
 Sri Lanka
-
 Sweden
-
 Switzerland
-
 Syria
Syria
-
 Taiwan
-
 Tajikistan
-
 Tanzania
-
 Thailand
-
 Trinidad and Tobago
-
 Tunisia
-
 Turkey
-
 UAE
UAE
-
 Uganda
-
 Ukraine
-
 United Kingdom
-
United States
-
 Uruguay
-
 Uzbekistan
-
 Venezuela
-
 Vietnam
-
 Yemen
Yemen
-
 Zambia
-
 Zimbabwe
- Forex
- Crypto












