

What's behind Hewlett Packard Enterprise's latest 7.1% stock pullback?

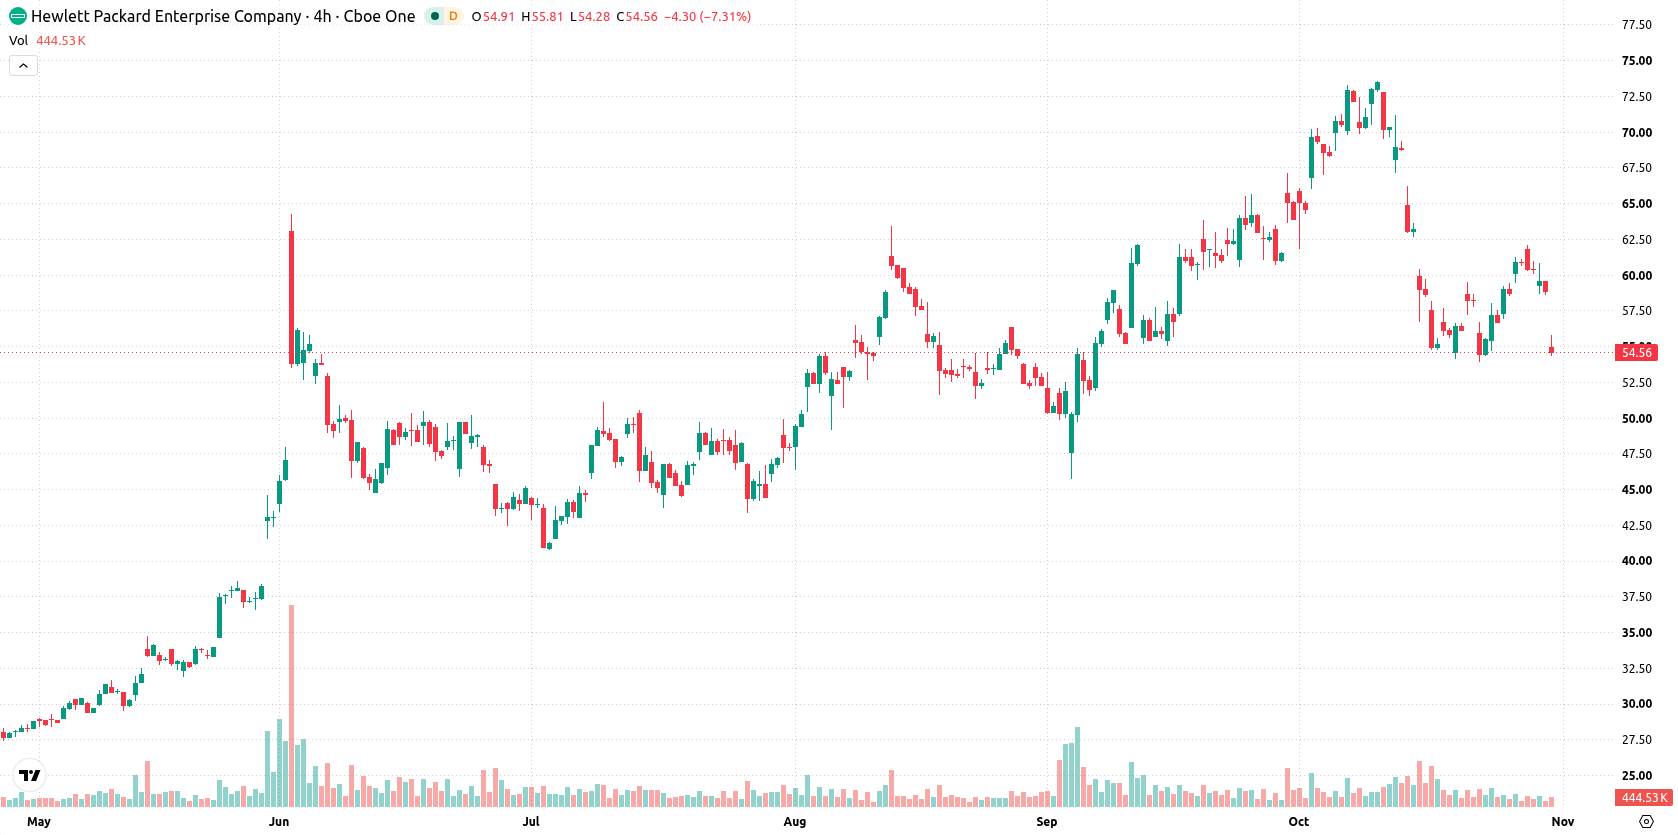
Hewlett Packard Enterprise Co (HPE) dropped 7.07% as investors repriced the stock against a backdrop of strong earnings expectations and ongoing product integration initiatives. The decline is supported by sustained downside signals, with HPE trading below both its 20-day and 50-day moving averages.
 55.71
62.10
Highlights
- Hewlett Packard Enterprise is expected to achieve a year-over-year EPS increase to $1.16 in Q4 2026.
- The company expanded its Oracle partnership to deploy Juniper Networking equipment in AI data centers and integrated EdgeConnect with HPE Mist and Aruba Central.
- Shares of Hewlett Packard Enterprise trade below short- and medium-term moving averages, with downside technical signals and an expected 5-session range of $49.88 to $57.34.
Earnings optimism contrasts with rising inventories and supply headwinds
Hewlett Packard Enterprise is preparing to report its Q4 2026 financial results, with analysts forecasting a notable year-over-year EPS increase to $1.16. The company expanded its partnership with Oracle to deploy Juniper Networking equipment in AI data centers and announced the integration of EdgeConnect with HPE Mist and Aruba Central to unify its networking framework. Inventory levels increased to $11.82 billion, accompanied by persistent supply constraints in memory, NAND, CPUs, and drives, though price action has remained under broader selling pressure.
Short-term pressure dominates as downside signals align with trading range
Hewlett Packard Enterprise is trading below its 20-day and 50-day moving averages at $63.09 and $59.67, respectively, but remains above the 200-day at $40.61. This positioning signals short- and medium-term downside pressure, while the long-term trend still carries a bullish bias. Immediate trading is contained between support at $54.22 and resistance at $55.85. Momentum indicators reinforce a downside bias as the Moving Average Convergence Divergence (MACD) and Average Directional Index (ADX) both signal "Sell." The Relative Strength Index (RSI) at 46.46 and Commodity Channel Index (CCI) at -42.26 detect no oversold condition, while Stochastic RSI sits neutral. Bull/Bear Power (BBP) stands at 0.87, indicating buyers have slight control intraday, though the BBP forecast signals an overbought condition. The stock opened with a downside gap of roughly $3.67 (down 6.23%) and is now trading near the day's low after slipping $4.165 or 7.07%, with intraday volatility at 3.01%. Intraday tone shows continued pressure after the open, and this matches the broad sell signals from most indicators.
Previously it was reported that Hewlett Packard Enterprise was facing technical resistance and mixed momentum, indicating persistent short- and medium-term challenges despite long-term support. The current price action reinforces this downside pressure, highlighting the key level at $54.22 as the immediate pivot for traders monitoring further downside risk.






Latest Hewlett Packard Enterprise Co News



-
 Afghanistan
-
 Albania
-
 Algeria
-
 Angola
-
 Argentina
-
 Armenia
-
 Australia
-
 Austria
-
 Azerbaijan
-
 Bahamas
-
 Bahrain
-
 Bangladesh
-
 Belarus
-
 Belgium
-
 Bolivia
-
 Botswana
-
 Brazil
-
 Brunei
-
 Bulgaria
-
 Cambodia
-
 Cameroon
-
 Canada
-
 Chile
-
 China
-
 Colombia
-
 Congo
-
 Costa Rica
-
 Cote d'Ivoire
-
 Croatia
-
 Cuba
-
 Cyprus
-
 Czechia
-
 DR Congo
-
 Denmark
-
 Dominican Republic
-
 Ecuador
-
 Egypt
-
 El Salvador
-
 Estonia
-
 Eswatini
-
 Ethiopia
-
 Finland
-
 France
-
 Georgia
-
 Germany
-
 Ghana
-
 Greece
-
 Haiti
-
 Hong Kong
-
 Hungary
-
 India
-
 Indonesia
-
 Iran, Islamic republic
-
 Iraq
-
 Ireland
-
 Israel
-
 Italy
-
 Jamaica
-
 Japan
-
 Jordan
-
 Kazakhstan
-
 Kenya
-
 Korea
-
 Kuwait
-
 Kyrgyzstan
-
 Laos
-
 Latvia
-
 Lebanon
-
 Lesotho
-
 Libya
-
 Lithuania
-
 Luxembourg
-
 Madagascar
-
 Malaysia
-
 Malta
-
 Mauritius
-
 Mexico
-
 Moldova
-
 Mongolia
-
 Montenegro
-
 Morocco
-
 Mozambique
-
 Myanmar
-
 Namibia
-
 Nepal
-
 Netherlands
-
 New Zealand
-
 Nigeria
-
 North Macedonia
-
 Norway
-
 Oman
-
 Pakistan
-
 Palestine
-
 Panama
-
 Papua New Guinea
-
 Paraguay
-
 Peru
-
 Philippines
-
 Poland
-
 Portugal
-
 Puerto Rico
-
 Qatar
-
 Reunion
-
 Romania
-
 Rwanda
-
 Saudi Arabia
-
 Serbia
-
 Singapore
-
 Slovakia
-
 Slovenia
-
 Somalia
-
 South Africa
-
 Spain
-
 Sri Lanka
-
 Sweden
-
 Switzerland
-
 Syria
-
 Taiwan
-
 Tajikistan
-
 Tanzania
-
 Thailand
-
 Trinidad and Tobago
-
 Tunisia
-
 Turkey
-
 UAE
-
 Uganda
-
 Ukraine
-
 United Kingdom
-
United States
-
 Uruguay
-
 Uzbekistan
-
 Venezuela
-
 Vietnam
-
 Yemen
-
 Zambia
-
 Zimbabwe
- Forex
- Crypto












