

What's behind Hewlett Packard Enterprise's latest stock surge?

Hewlett Packard Enterprise Co (HPE) climbed 3.36% in a technically driven session as a surge from deeply oversold conditions triggered a rebound. The move looks limited, with HPE trading below both its 20-day and 50-day moving averages and facing immediate resistance near $57.66.
 55.71
62.10
Highlights
- Shares of Hewlett Packard Enterprise trade below key short- and medium-term moving averages but remain well above their long-term support.
- Momentum and oscillator readings indicate strong selling pressure, with multiple signals registering the stock as oversold.
- The next five-day price range is projected to be $48.81 to $65.17, with a near 52% probability of a downward move and baseline expectation of sideways action.
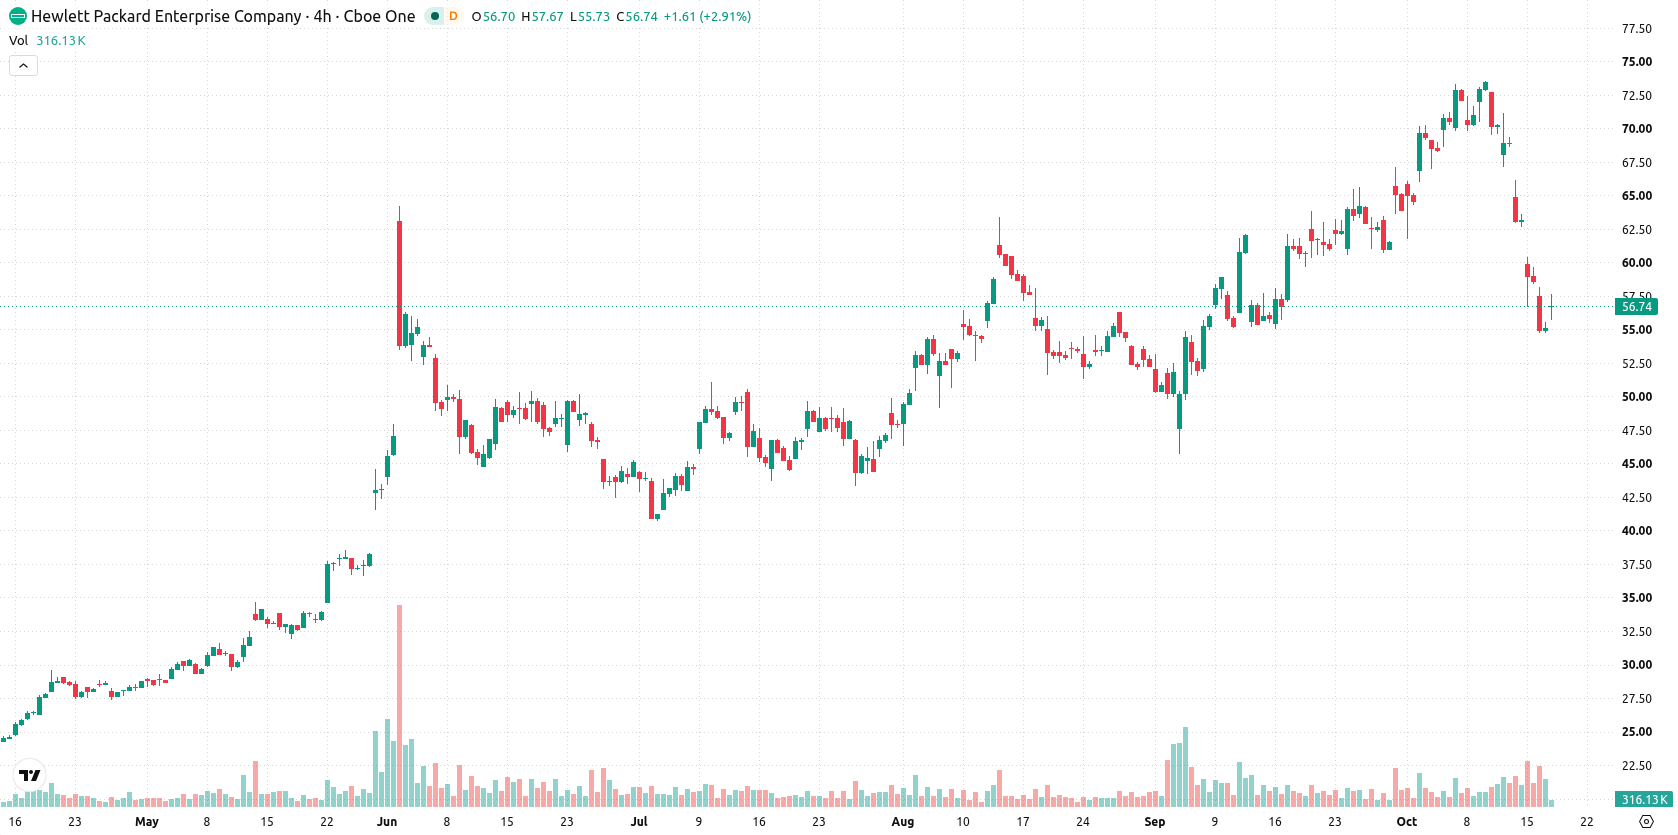
Mixed momentum as HPE meets resistance amid seller dominance
HPE is trading below the 20-day ($65.25) and 50-day ($59.37) moving averages, but remains well above the 200-day ($39.04), indicating short- and medium-term selling pressure while long-term support persists. The Ichimoku Kijun at $64.13 stands as distant resistance, with near-term technical resistance at $57.66 and support at $54.74. Momentum readings are mixed: MACD signals strong bullish momentum, but the ADX and RSI point to continued selling, with the RSI deeply oversold at 37.41. Stochastic RSI and CCI are also in oversold territory, and the Bull/Bear Power at -6.24 underscores seller dominance. The stock trades close to the session high with a daily volatility of 5.33%, showing near-term strength despite underlying divergence among technical indicators.
Earlier, analysts noted that Hewlett Packard Enterprise remained in a strong uptrend despite warnings of short-term pullbacks from overbought conditions. The latest technical setup adds a new dimension, with increased volatility and mixed momentum readings now highlighting $54.74 as a pivotal support level to watch for the next decisive move.






Latest Hewlett Packard Enterprise Co News




-
 Afghanistan
-
 Albania
-
 Algeria
-
 Angola
-
 Argentina
-
 Armenia
-
 Australia
-
 Austria
-
 Azerbaijan
-
 Bahamas
-
 Bahrain
-
 Bangladesh
-
 Belarus
-
 Belgium
-
 Bolivia
-
 Botswana
-
 Brazil
-
 Brunei
-
 Bulgaria
-
 Cambodia
-
 Cameroon
-
 Canada
-
 Chile
-
 China
-
 Colombia
-
 Congo
-
 Costa Rica
-
 Cote d'Ivoire
-
 Croatia
-
 Cuba
-
 Cyprus
-
 Czechia
-
 DR Congo
-
 Denmark
-
 Dominican Republic
-
 Ecuador
-
 Egypt
-
 El Salvador
-
 Estonia
-
 Eswatini
-
 Ethiopia
-
 Finland
-
 France
-
 Georgia
-
 Germany
-
 Ghana
-
 Greece
-
 Haiti
-
 Hong Kong
-
 Hungary
-
 India
-
 Indonesia
-
 Iran, Islamic republic
-
 Iraq
-
 Ireland
-
 Israel
-
 Italy
-
 Jamaica
-
 Japan
-
 Jordan
-
 Kazakhstan
-
 Kenya
-
 Korea
-
 Kuwait
-
 Kyrgyzstan
-
 Laos
-
 Latvia
-
 Lebanon
-
 Lesotho
-
 Libya
-
 Lithuania
-
 Luxembourg
-
 Madagascar
-
 Malaysia
-
 Malta
-
 Mauritius
-
 Mexico
-
 Moldova
-
 Mongolia
-
 Montenegro
-
 Morocco
-
 Mozambique
-
 Myanmar
-
 Namibia
-
 Nepal
-
 Netherlands
-
 New Zealand
-
 Nigeria
-
 North Macedonia
-
 Norway
-
 Oman
-
 Pakistan
-
 Palestine
-
 Panama
-
 Papua New Guinea
-
 Paraguay
-
 Peru
-
 Philippines
-
 Poland
-
 Portugal
-
 Puerto Rico
-
 Qatar
-
 Reunion
-
 Romania
-
 Rwanda
-
 Saudi Arabia
-
 Serbia
-
 Singapore
-
 Slovakia
-
 Slovenia
-
 Somalia
-
 South Africa
-
 Spain
-
 Sri Lanka
-
 Sweden
-
 Switzerland
-
 Syria
-
 Taiwan
-
 Tajikistan
-
 Tanzania
-
 Thailand
-
 Trinidad and Tobago
-
 Tunisia
-
 Turkey
-
 UAE
-
 Uganda
-
 Ukraine
-
 United Kingdom
-
United States
-
 Uruguay
-
 Uzbekistan
-
 Venezuela
-
 Vietnam
-
 Yemen
-
 Zambia
-
 Zimbabwe
- Forex
- Crypto












