

Akamai stock drops as weak momentum follows Q2 2026 earnings release

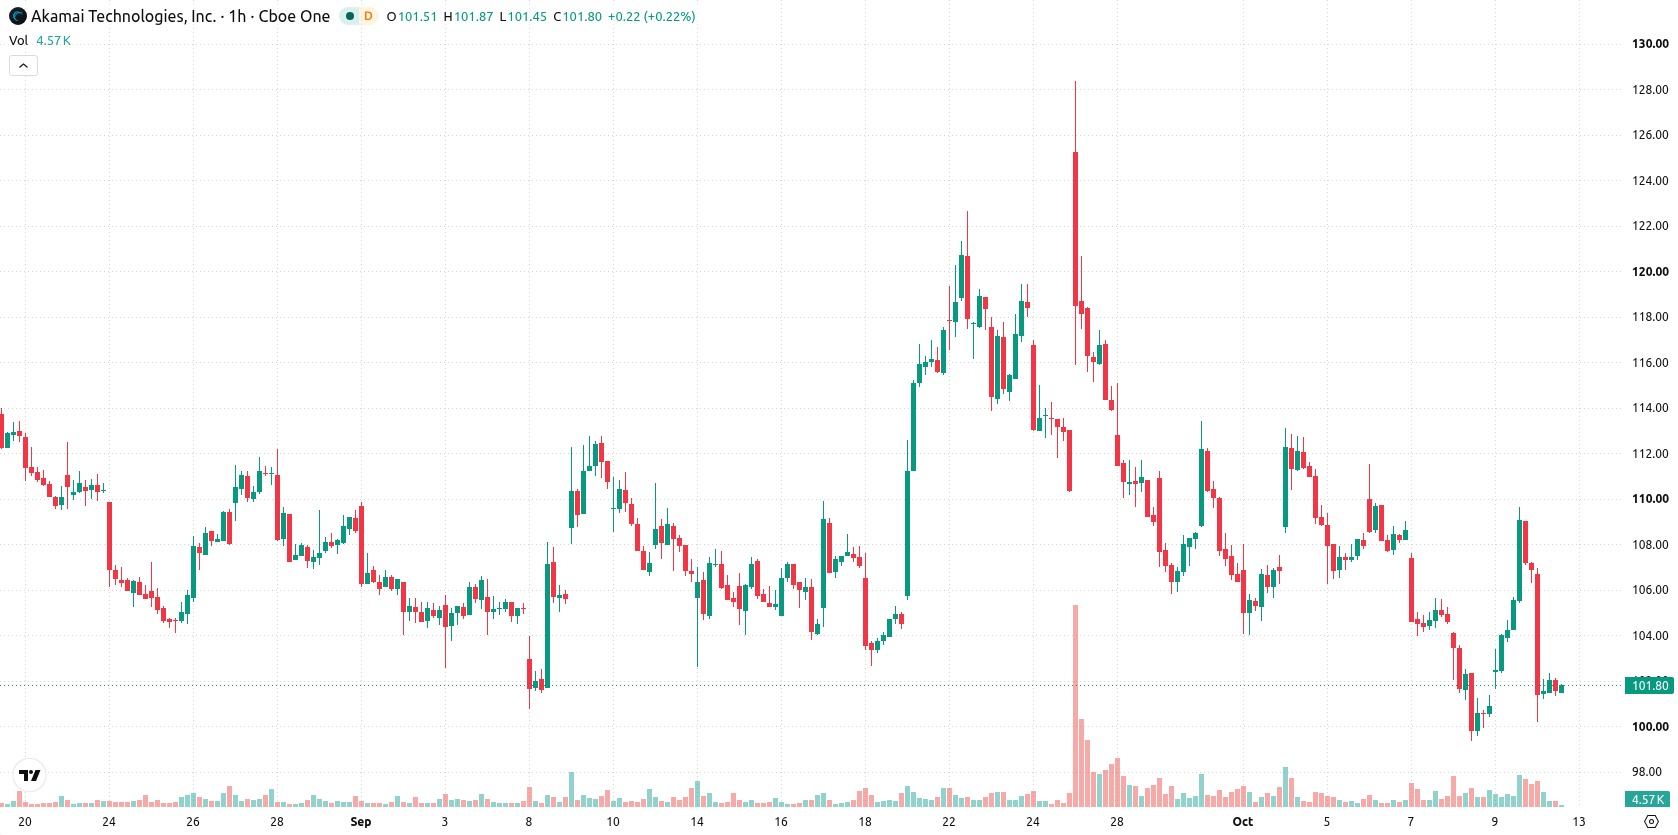
Akamai Technologies Inc. (AKAM) stock is trading at $101.68, marking a daily decline of 4.94%. The stock currently remains below its key moving averages, suggesting notable seller dominance across multiple timeframes.
 106.92
111.47
106.92
111.47
Highlights
- Akamai Technologies reported its Q2 2026 financial results, providing investors with updated details on the company’s financial position and outlook.
- Akamai was named a Leader in the IDC MarketScape Web Application and API Protection Platforms 2026 assessment, with recognition for AI security and edge network investments.
- Shares of Akamai are under sustained selling pressure, trading below key moving averages with bearish momentum and a projected trading range of $96.26 to $107.1 over the next two to three days.
Financial update and leadership recognition contrast with continued price weakness
Akamai Technologies reported its second-quarter 2026 financial results, with CEO Tom Leighton and CFO Ed McGowan providing commentary on earnings during the quarterly call, as detailed by Benzinga. This release offered investors an updated view into Akamai's current financial condition and outlook, with results that can directly influence portfolio positioning. Separately, Akamai was recognized as a Leader in the IDC MarketScape: Worldwide Web Application and API Protection Platforms 2026 Vendor Assessment, according to Manilatimes, highlighting its AI security investments and edge network capabilities, though price action has remained under broader selling pressure.
Multiple timeframe resistance and negative momentum reinforce sell bias
On the technical front, AKAM has slipped below its MA-20 ($103.57), MA-50 ($106.23), and MA-200 ($112.11), confirming multiple timeframe resistance zones. The Ichimoku Kijun level at $104.49 is serving as immediate resistance, capping any upside attempts for now. Momentum indicators reinforce this stance: MACD remains on a strong sell, ADX points to neutral trend strength, and key oscillators such as RSI (40.97) and CCI signal ongoing selling pressure. Both Stochastic RSI and Awesome Oscillator are neutral, but Bull/Bear Power shows a clear advantage for sellers as the stock closed near the day's lows under high volatility.
Downside risk elevated as volatility caps rebound prospects
Looking ahead to the next two to three trading days, the expected price range is between $96.26 and $107.1, reflecting the volatility band relative to current levels. The likelihood of a significant upward move is low, with downside risk remaining elevated and minimal prospects for a strong rebound. The base-case scenario calls for sideways trading within this zone, with a bullish reversal requiring a break above $104.49, while a fall below $96.26 would likely trigger a fresh leg lower.
Earlier, analysts noted that Akamai faced sustained technical weakness even as operational growth and AI security initiatives ramped up. The current analysis reinforces this bearish view, highlighting persistent downside risk, with traders advised to monitor for a decisive move below $96.26 as an early signal of a potential further decline.





Latest Akamai Technologies Inc News






-
 Afghanistan
-
 Albania
-
 Algeria
-
 Angola
-
 Argentina
-
 Armenia
-
 Australia
-
 Austria
-
 Azerbaijan
-
 Bahamas
-
 Bahrain
-
 Bangladesh
-
 Belarus
-
 Belgium
-
 Bolivia
-
 Botswana
-
 Brazil
-
 Brunei
-
 Bulgaria
-
 Cambodia
-
 Cameroon
-
 Canada
-
 Chile
Chile
-
 China
China
-
 Colombia
-
 Congo
Congo
-
 Costa Rica
-
 Cote d'Ivoire
-
 Croatia
-
 Cuba
Cuba
-
 Cyprus
-
 Czechia
-
 DR Congo
-
 Denmark
-
 Dominican Republic
-
 Ecuador
-
 Egypt
Egypt
-
 El Salvador
-
 Estonia
-
 Eswatini
-
 Ethiopia
-
 Finland
-
 France
-
 Georgia
-
 Germany
-
 Ghana
Ghana
-
 Greece
-
 Haiti
Haiti
-
 Hong Kong
-
 Hungary
-
 India
India
-
 Indonesia
-
 Iran, Islamic republic
-
 Iraq
Iraq
-
 Ireland
-
 Israel
-
 Italy
Italy
-
 Jamaica
-
 Japan
Japan
-
 Jordan
-
 Kazakhstan
-
 Kenya
Kenya
-
 Korea
Korea
-
 Kuwait
-
 Kyrgyzstan
-
 Laos
Laos
-
 Latvia
-
 Lebanon
-
 Lesotho
-
 Libya
Libya
-
 Lithuania
-
 Luxembourg
-
 Madagascar
-
 Malaysia
-
 Malta
Malta
-
 Mauritius
-
 Mexico
-
 Moldova
-
 Mongolia
-
 Montenegro
-
 Morocco
-
 Mozambique
-
 Myanmar
-
 Namibia
-
 Nepal
Nepal
-
 Netherlands
-
 New Zealand
-
 Nigeria
-
 North Macedonia
-
 Norway
-
 Oman
Oman
-
 Pakistan
-
 Palestine
-
 Panama
-
 Papua New Guinea
-
 Paraguay
-
 Peru
Peru
-
 Philippines
-
 Poland
-
 Portugal
-
 Puerto Rico
-
 Qatar
Qatar
-
 Reunion
-
 Romania
-
 Rwanda
-
 Saudi Arabia
-
 Serbia
-
 Singapore
-
 Slovakia
-
 Slovenia
-
 Somalia
-
 South Africa
-
 Spain
Spain
-
 Sri Lanka
-
 Sweden
-
 Switzerland
-
 Syria
Syria
-
 Taiwan
-
 Tajikistan
-
 Tanzania
-
 Thailand
-
 Trinidad and Tobago
-
 Tunisia
-
 Turkey
-
 UAE
UAE
-
 Uganda
-
 Ukraine
-
 United Kingdom
-
United States
-
 Uruguay
-
 Uzbekistan
-
 Venezuela
-
 Vietnam
-
 Yemen
Yemen
-
 Zambia
-
 Zimbabwe
- Forex
- Crypto












