

Rivian shares technical analysis: Weak momentum persists with downside risk toward $13.1 support

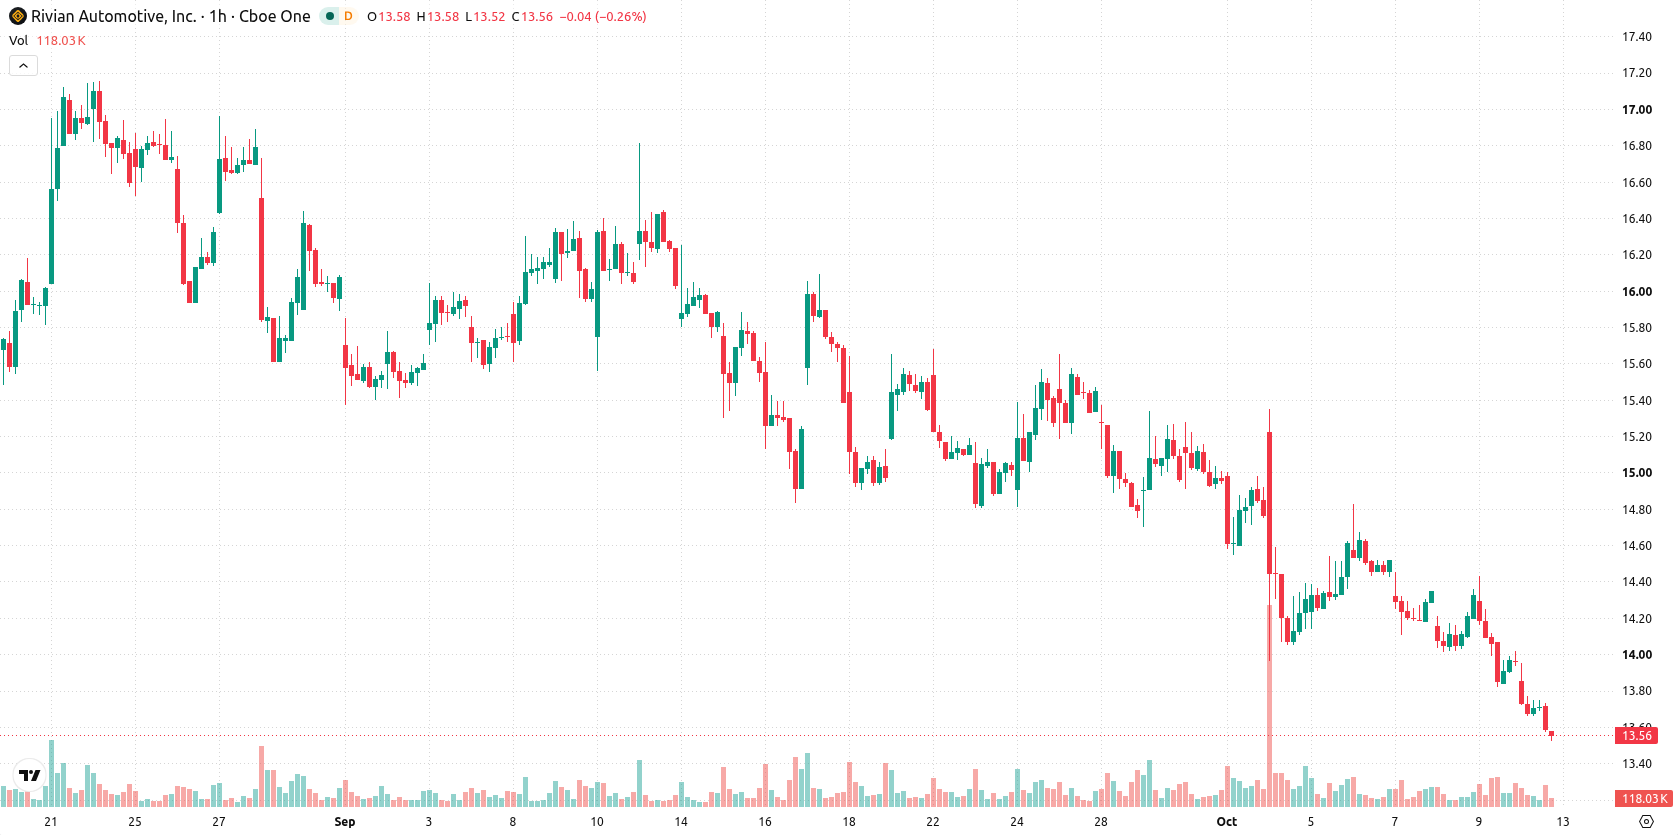
Rivian (RIVN) stock is trading at $13.55, marking a daily decline of 3.01% and positioning the price below its key moving averages. The current level is reflective of persistent selling momentum and remains anchored near the session low amid moderate volatility.
 13.89
14.82
13.89
14.82
Highlights
- Rivian delivered 19,248 vehicles in third-quarter 2026, a 45.8% increase from the previous year.
- Institutional sales included 977 electric vehicles delivered to the California Department of Transportation, under a $97 million contract.
- Rivian stock trades below key moving averages with momentum and oscillators showing heavy selling pressure, and the expected range is $13.1 to $14 with high downside risk.
Institutional deliveries and new production shift offset by price pressure
Rivian reported third-quarter 2026 deliveries of 19,248 vehicles, a 45.8% increase from the prior year, demonstrating the company’s ability to scale production and bring new units to market, according to Yahoo Finance. This operational milestone is complemented by the start of a second production shift for the R2 SUV at the Normal, Illinois plant before September 2026, as noted by Eletric Vehicles, which is intended to further expand manufacturing capacity. Additionally, institutional sales have played a role, with Rivian delivering 977 electric vehicles to the California Department of Transportation under a statewide contract valued at approximately $97 million, highlighting continued penetration into government and fleet markets. Despite these advances, price action has remained under broader selling pressure.
Technical signals mixed as oversold readings clash with neutral trend strength
On the H1 timeframe, the price remains below the MA-20 at $14.09 and MA-50 at $14.31, with the daily chart also showing the price well under the MA-200 at $16.02. The Ichimoku Kijun sits at $14.05, serving as near-term resistance. RSI is at 29.46, while both MACD and the Awesome Oscillator continue to signal sell conditions. Stochastic RSI and CCI readings are in oversold territory, yet ADX remains neutral, indicating that overall trend strength is inconclusive. Bull/Bear Power shows that sellers are currently dominating the market.
Limited upside as bearish risks dominate short-term trading range
Over the coming days, RIVN is expected to trade within a band of $13.1 to $14 in line with typical volatility. The probability of a breakout to the upside remains very low absent a sustained move above resistance at $14.05. Conversely, any decisive move below support at $13.1 would likely trigger additional bearish momentum, while sideways consolidation within the established range represents the baseline scenario.
Previously it was reported that Rivian faced elevated downside risk and persistent technical resistance despite securing a significant liquidity boost from its Volkswagen partnership. The current analysis reinforces this cautious view, highlighting that the prevailing scenario remains sideways consolidation within the $13.1 to $14 trading band, with a breakdown below $13.1 signaling further downside risk.





Latest Rivian Automotive News






-
 Afghanistan
-
 Albania
-
 Algeria
-
 Angola
-
 Argentina
-
 Armenia
-
 Australia
-
 Austria
-
 Azerbaijan
-
 Bahamas
-
 Bahrain
-
 Bangladesh
-
 Belarus
-
 Belgium
-
 Bolivia
-
 Botswana
-
 Brazil
-
 Brunei
-
 Bulgaria
-
 Cambodia
-
 Cameroon
-
 Canada
-
 Chile
Chile
-
 China
China
-
 Colombia
-
 Congo
Congo
-
 Costa Rica
-
 Cote d'Ivoire
-
 Croatia
-
 Cuba
Cuba
-
 Cyprus
-
 Czechia
-
 DR Congo
-
 Denmark
-
 Dominican Republic
-
 Ecuador
-
 Egypt
Egypt
-
 El Salvador
-
 Estonia
-
 Eswatini
-
 Ethiopia
-
 Finland
-
 France
-
 Georgia
-
 Germany
-
 Ghana
Ghana
-
 Greece
-
 Haiti
Haiti
-
 Hong Kong
-
 Hungary
-
 India
India
-
 Indonesia
-
 Iran, Islamic republic
-
 Iraq
Iraq
-
 Ireland
-
 Israel
-
 Italy
Italy
-
 Jamaica
-
 Japan
Japan
-
 Jordan
-
 Kazakhstan
-
 Kenya
Kenya
-
 Korea
Korea
-
 Kuwait
-
 Kyrgyzstan
-
 Laos
Laos
-
 Latvia
-
 Lebanon
-
 Lesotho
-
 Libya
Libya
-
 Lithuania
-
 Luxembourg
-
 Madagascar
-
 Malaysia
-
 Malta
Malta
-
 Mauritius
-
 Mexico
-
 Moldova
-
 Mongolia
-
 Montenegro
-
 Morocco
-
 Mozambique
-
 Myanmar
-
 Namibia
-
 Nepal
Nepal
-
 Netherlands
-
 New Zealand
-
 Nigeria
-
 North Macedonia
-
 Norway
-
 Oman
Oman
-
 Pakistan
-
 Palestine
-
 Panama
-
 Papua New Guinea
-
 Paraguay
-
 Peru
Peru
-
 Philippines
-
 Poland
-
 Portugal
-
 Puerto Rico
-
 Qatar
Qatar
-
 Reunion
-
 Romania
-
 Rwanda
-
 Saudi Arabia
-
 Serbia
-
 Singapore
-
 Slovakia
-
 Slovenia
-
 Somalia
-
 South Africa
-
 Spain
Spain
-
 Sri Lanka
-
 Sweden
-
 Switzerland
-
 Syria
Syria
-
 Taiwan
-
 Tajikistan
-
 Tanzania
-
 Thailand
-
 Trinidad and Tobago
-
 Tunisia
-
 Turkey
-
 UAE
UAE
-
 Uganda
-
 Ukraine
-
 United Kingdom
-
United States
-
 Uruguay
-
 Uzbekistan
-
 Venezuela
-
 Vietnam
-
 Yemen
Yemen
-
 Zambia
-
 Zimbabwe
- Forex
- Crypto












