


SNDL Inc. (SNDL) extended its decline by 3.4% as persistent selling momentum continues to dominate, with key technical indicators flashing oversold signals and intraday volatility subdued. The move is supported by the stock trading below its 20-, 50-, and 200-day moving averages, reinforcing sustained bearish pressure.
 1.19
1.26
1.19
1.26
Highlights
- SNDL stock trades below key moving averages across all time frames, indicating sustained downward pressure.
- Momentum and oscillators confirm oversold conditions as sellers dominate intraday moves and price holds near session lows.
- Expected five-day range is $1.09 to $1.18, with over 80% probability of further downside and low likelihood of a rebound.
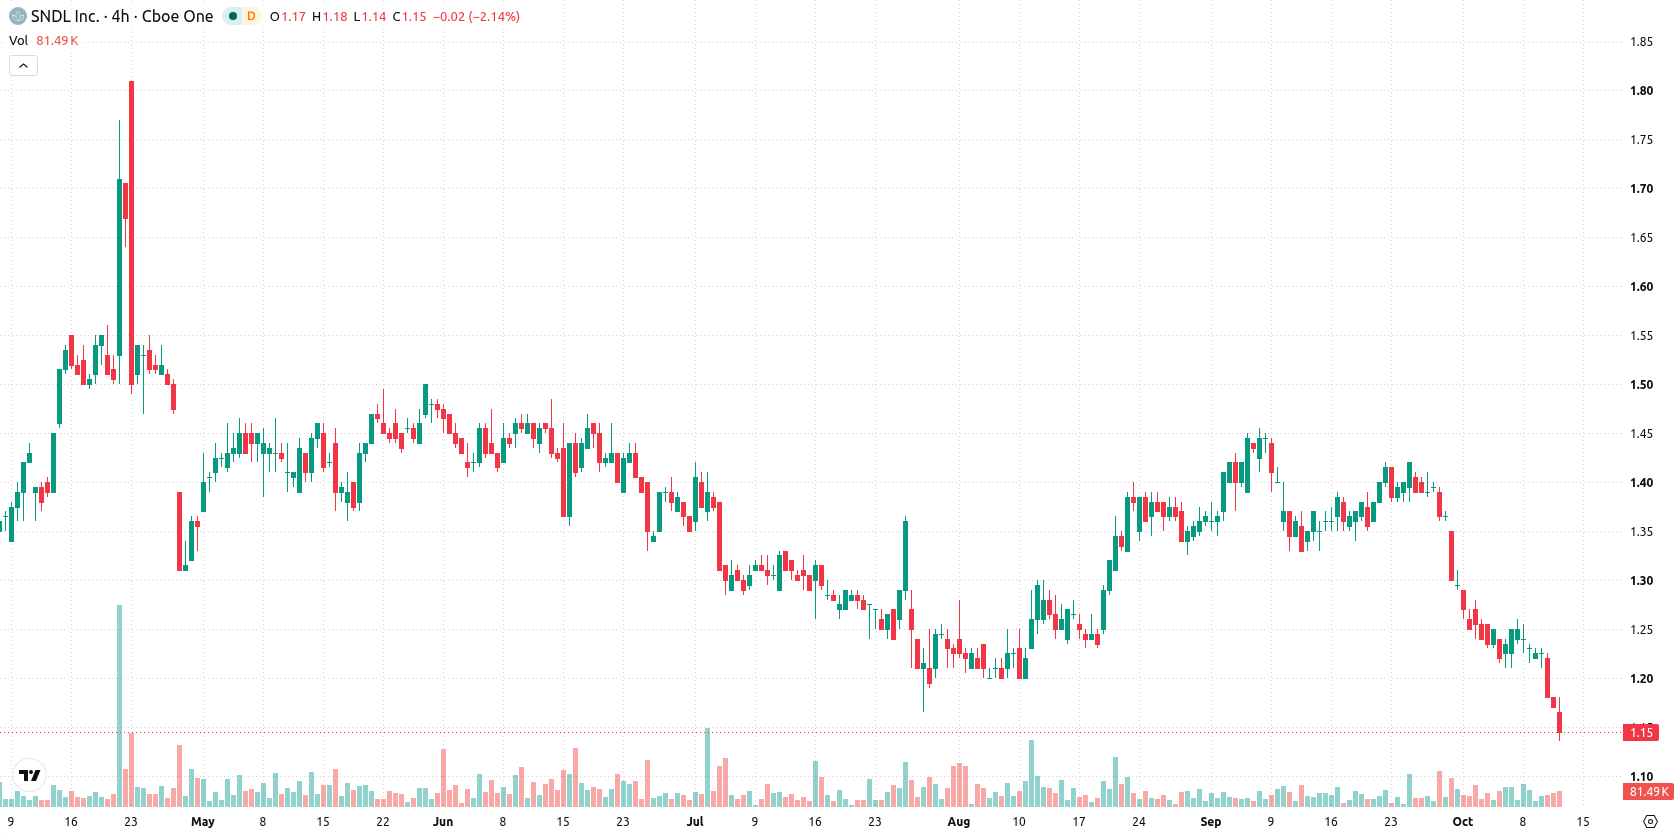
Bearish momentum intensifies as technical barriers persist
SNDL is trading below the 20-day ($1.32), 50-day ($1.32), and 200-day ($1.42) moving averages, highlighting sustained selling pressure across all primary timeframes. The Ichimoku Kijun at $1.31 remains well above the current level, confirming overhead resistance and a bearish structure. Immediate resistance stands at $1.17, with support at $1.09. Momentum readings are weak: the MACD and ADX signal a strong selling trend, and the RSI at 29.22, along with oversold readings on the Stochastic RSI and CCI, reinforce this. The Bull/Bear Power is negative, showing sellers dominate intraday movement, while the Awesome Oscillator adds to the bearish outlook. Price action remains pressured near the session low after an opening gap to the downside, with intraday volatility contained at 0.85%.
Earlier, analysts noted that SNDL was experiencing sustained selling pressure with technical indicators aligning to support a bearish outlook. The current analysis reinforces this view, highlighting that any decisive move below the $1.09 support would further confirm downside momentum and establish it as the pivotal level to monitor in the near term.





Latest SNDL News





-
 Afghanistan
-
 Albania
-
 Algeria
-
 Angola
-
 Argentina
-
 Armenia
-
 Australia
-
 Austria
-
 Azerbaijan
-
 Bahamas
-
 Bahrain
-
 Bangladesh
-
 Belarus
-
 Belgium
-
 Bolivia
-
 Botswana
-
 Brazil
-
 Brunei
-
 Bulgaria
-
 Cambodia
-
 Cameroon
-
 Canada
-
 Chile
Chile
-
 China
China
-
 Colombia
-
 Congo
Congo
-
 Costa Rica
-
 Cote d'Ivoire
-
 Croatia
-
 Cuba
Cuba
-
 Cyprus
-
 Czechia
-
 DR Congo
-
 Denmark
-
 Dominican Republic
-
 Ecuador
-
 Egypt
Egypt
-
 El Salvador
-
 Estonia
-
 Eswatini
-
 Ethiopia
-
 Finland
-
 France
-
 Georgia
-
 Germany
-
 Ghana
Ghana
-
 Greece
-
 Haiti
Haiti
-
 Hong Kong
-
 Hungary
-
 India
India
-
 Indonesia
-
 Iran, Islamic republic
-
 Iraq
Iraq
-
 Ireland
-
 Israel
-
 Italy
Italy
-
 Jamaica
-
 Japan
Japan
-
 Jordan
-
 Kazakhstan
-
 Kenya
Kenya
-
 Korea
Korea
-
 Kuwait
-
 Kyrgyzstan
-
 Laos
Laos
-
 Latvia
-
 Lebanon
-
 Lesotho
-
 Libya
Libya
-
 Lithuania
-
 Luxembourg
-
 Madagascar
-
 Malaysia
-
 Malta
Malta
-
 Mauritius
-
 Mexico
-
 Moldova
-
 Mongolia
-
 Montenegro
-
 Morocco
-
 Mozambique
-
 Myanmar
-
 Namibia
-
 Nepal
Nepal
-
 Netherlands
-
 New Zealand
-
 Nigeria
-
 North Macedonia
-
 Norway
-
 Oman
Oman
-
 Pakistan
-
 Palestine
-
 Panama
-
 Papua New Guinea
-
 Paraguay
-
 Peru
Peru
-
 Philippines
-
 Poland
-
 Portugal
-
 Puerto Rico
-
 Qatar
Qatar
-
 Reunion
-
 Romania
-
 Rwanda
-
 Saudi Arabia
-
 Serbia
-
 Singapore
-
 Slovakia
-
 Slovenia
-
 Somalia
-
 South Africa
-
 Spain
Spain
-
 Sri Lanka
-
 Sweden
-
 Switzerland
-
 Syria
Syria
-
 Taiwan
-
 Tajikistan
-
 Tanzania
-
 Thailand
-
 Trinidad and Tobago
-
 Tunisia
-
 Turkey
-
 UAE
UAE
-
 Uganda
-
 Ukraine
-
 United Kingdom
-
United States
-
 Uruguay
-
 Uzbekistan
-
 Venezuela
-
 Vietnam
-
 Yemen
Yemen
-
 Zambia
-
 Zimbabwe
- Forex
- Crypto












