

Will SNDL stock hold the $1.14 support as seller dominance continues?

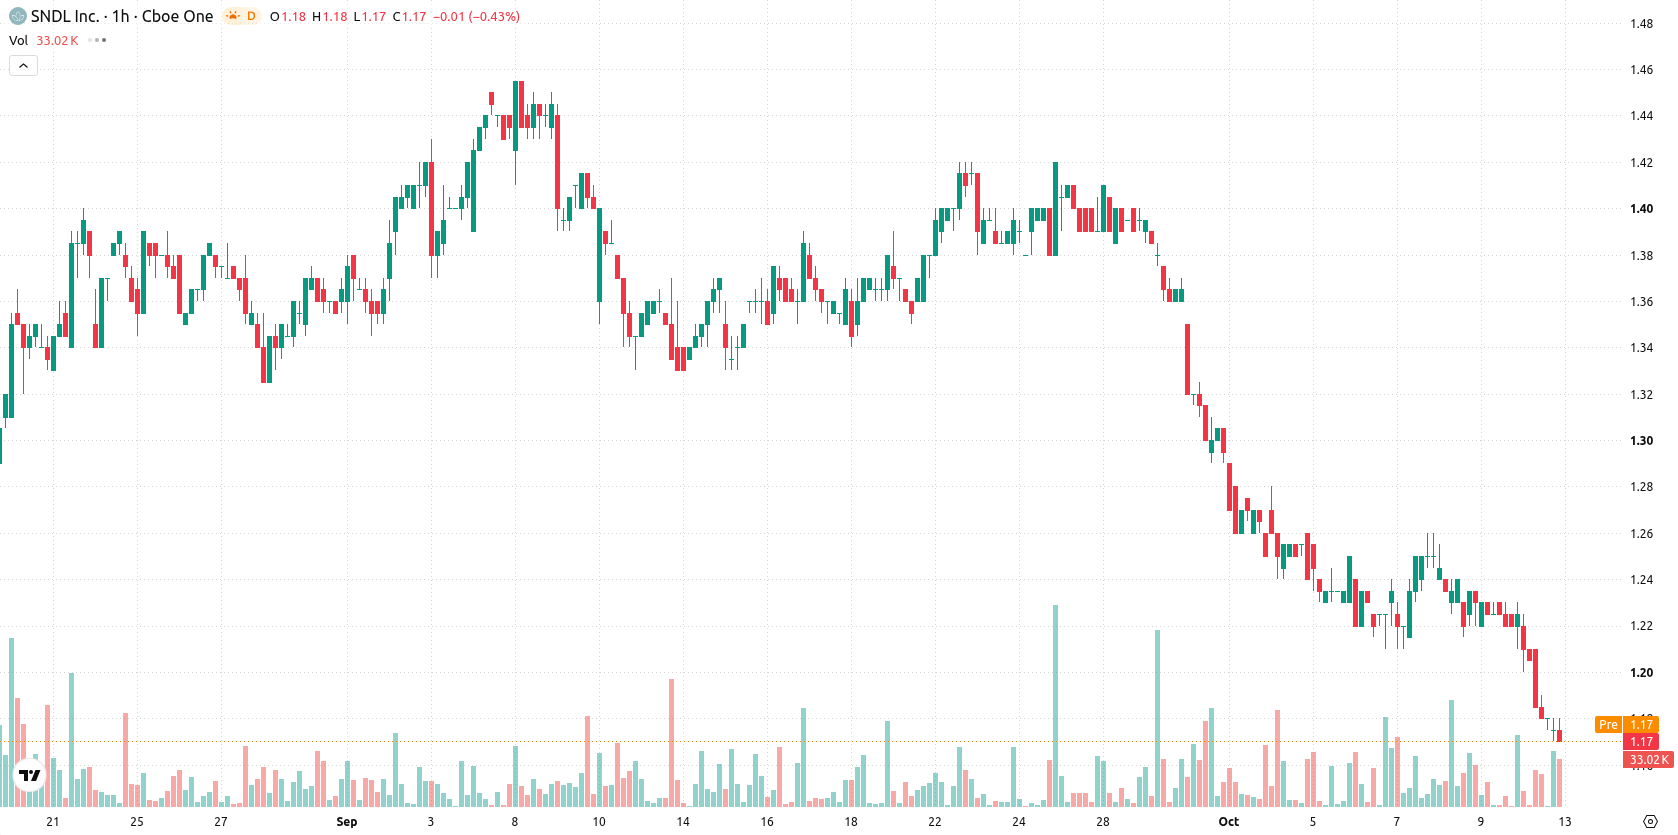
SNDL Inc. (SNDL) stock is trading at $1.18, marking a daily decline of 3.67%. The price remains below its key moving averages, indicating ongoing selling pressure relative to recent trends.
 1.36
1.34
Highlights
- SNDL stock trades below short, medium, and long-term moving averages, maintaining sustained bearish momentum.
- Momentum indicators confirm a negative trend with oversold conditions and sellers dominating intraday action.
- Price closed at $1.18, down 3.67% today, with the expected trading range at $1.14 to $1.22 and high risk of further downside.
Persistent downtrend confirmed as resistance and momentum weaken
SNDL is trading below the MA-20 at $1.21, the MA-50 at $1.23, and the MA-200 at $1.42. The Ichimoku Kijun sits at $1.21 and serves as immediate resistance. Momentum readings are negative, as both MACD and ADX signal a persistent downtrend. The RSI is at 33.78, indicating a sell reading, while CCI reflects oversold conditions and Stochastic RSI is neutral. Bull/Bear Power shows intraday seller dominance, and the Awesome Oscillator supports the continuation of the negative trend.
Sideways movement expected as resistance and support define scenario
Over the coming days, SNDL is expected to trade within a typical volatility band of $1.14 to $1.22. The primary scenario sees price movement sideways in this corridor. A modest rebound could occur if the stock breaks above the $1.21 resistance, which may prompt an intraday momentum shift. Conversely, a decisive move below $1.14 would likely accelerate downside pressure and deepen negative sentiment.
Earlier, analysts noted that SNDL remained under pronounced selling pressure, with technical signals aligning to support a continued bearish outlook. The current analysis reinforces this perspective, highlighting that as long as SNDL trades beneath the $1.21 resistance, risk remains skewed to the downside with $1.14 serving as the next crucial level to watch.









-
 Afghanistan
-
 Albania
-
 Algeria
-
 Angola
-
 Argentina
-
 Armenia
-
 Australia
-
 Austria
-
 Azerbaijan
-
 Bahamas
-
 Bahrain
-
 Bangladesh
-
 Belarus
-
 Belgium
-
 Bolivia
-
 Botswana
-
 Brazil
-
 Brunei
-
 Bulgaria
-
 Cambodia
-
 Cameroon
-
 Canada
-
 Chile
-
 China
-
 Colombia
-
 Congo
-
 Costa Rica
-
 Cote d'Ivoire
-
 Croatia
-
 Cuba
-
 Cyprus
-
 Czechia
-
 DR Congo
-
 Denmark
-
 Dominican Republic
-
 Ecuador
-
 Egypt
-
 El Salvador
-
 Estonia
-
 Eswatini
-
 Ethiopia
-
 Finland
-
 France
-
 Georgia
-
 Germany
-
 Ghana
-
 Greece
-
 Haiti
-
 Hong Kong
-
 Hungary
-
 India
-
 Indonesia
-
 Iran, Islamic republic
-
 Iraq
-
 Ireland
-
 Israel
-
 Italy
-
 Jamaica
-
 Japan
-
 Jordan
-
 Kazakhstan
-
 Kenya
-
 Korea
-
 Kuwait
-
 Kyrgyzstan
-
 Laos
-
 Latvia
-
 Lebanon
-
 Lesotho
-
 Libya
-
 Lithuania
-
 Luxembourg
-
 Madagascar
-
 Malaysia
-
 Malta
-
 Mauritius
-
 Mexico
-
 Moldova
-
 Mongolia
-
 Montenegro
-
 Morocco
-
 Mozambique
-
 Myanmar
-
 Namibia
-
 Nepal
-
 Netherlands
-
 New Zealand
-
 Nigeria
-
 North Macedonia
-
 Norway
-
 Oman
-
 Pakistan
-
 Palestine
-
 Panama
-
 Papua New Guinea
-
 Paraguay
-
 Peru
-
 Philippines
-
 Poland
-
 Portugal
-
 Puerto Rico
-
 Qatar
-
 Reunion
-
 Romania
-
 Rwanda
-
 Saudi Arabia
-
 Serbia
-
 Singapore
-
 Slovakia
-
 Slovenia
-
 Somalia
-
 South Africa
-
 Spain
-
 Sri Lanka
-
 Sweden
-
 Switzerland
-
 Syria
-
 Taiwan
-
 Tajikistan
-
 Tanzania
-
 Thailand
-
 Trinidad and Tobago
-
 Tunisia
-
 Turkey
-
 UAE
-
 Uganda
-
 Ukraine
-
 United Kingdom
-
United States
-
 Uruguay
-
 Uzbekistan
-
 Venezuela
-
 Vietnam
-
 Yemen
-
 Zambia
-
 Zimbabwe
- Forex
- Crypto












