

Will SNDL stock test upside momentum amid weak short-term signals?

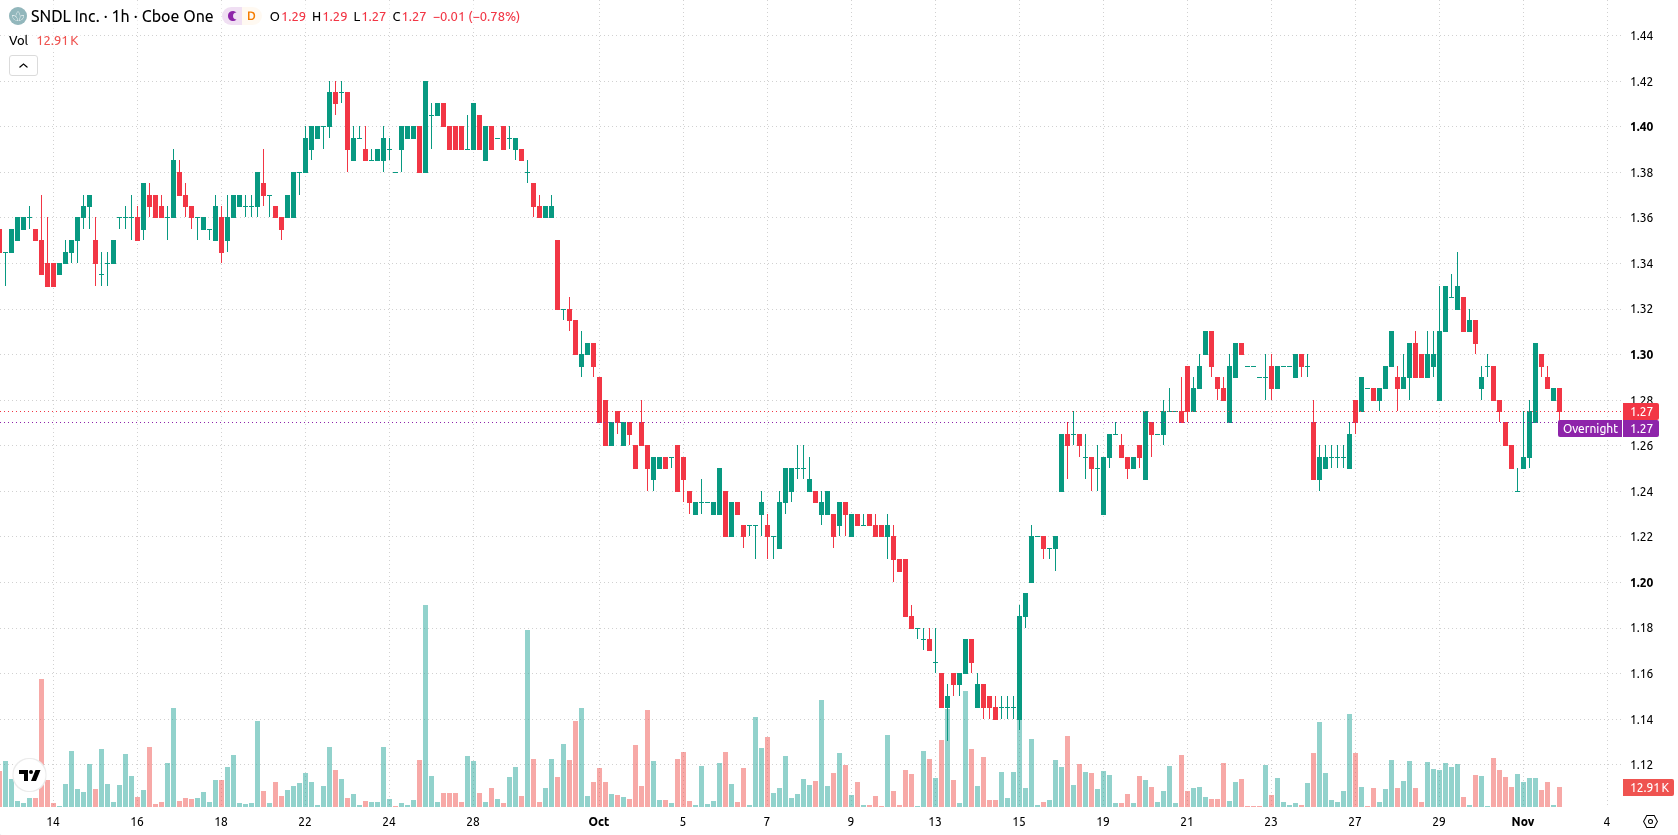
SNDL Inc. (SNDL) stock is trading at $1.28, up 2.81% on the day as it moves mid-range during a session of heightened volatility. The stock is currently below its key short-term average and above the medium-term average, indicating a mixed position relative to moving averages.
 1.31
1.34
Highlights
- SNDL/USD remains under medium-term selling pressure and a bearish long-term structure as it trades below key moving averages.
- Technical indicators are mixed with momentum signals skewing weak to negative, and no clear overbought or oversold conditions present.
- Trading at $1.28 with a 2.81% daily gain, the projected range is $1.24 to $1.32 with equally balanced breakout probabilities.
Resistance holds as weak momentum and mixed signals persist
On the H1 chart, SNDL is trading below the MA-20 and just above the MA-50, while remaining well under the MA-200. The Ichimoku Kijun at $1.29 presents immediate resistance. Momentum readings are mixed: MACD indicates a strong sell, ADX is neutral, and RSI is at 45.95. Stoch RSI signals a sell, CCI is neutral, and Bull/Bear Power suggests intraday buyer strength despite prevailing weak momentum. The Awesome Oscillator remains neutral.
Sideways trend expected as breakout risks remain balanced
For the next several sessions, SNDL is forecasted to trade in a range from $1.24 to $1.32, with an even probability of moving either direction in the short term. The baseline scenario will likely see the stock moving sideways between support and resistance. Should the price break above $1.29, upside momentum could emerge, while a drop below $1.24 would likely trigger renewed selling pressure.
Earlier, analysts noted that SNDL was experiencing a contested technical setup, with short-term rebounds occurring within a predominantly bearish structure. Today’s price action and indicator readings reinforce this mixed outlook, making $1.29 an important resistance level to watch for a potential shift in near-term trend direction.








-
 Afghanistan
-
 Albania
-
 Algeria
-
 Angola
-
 Argentina
-
 Armenia
-
 Australia
-
 Austria
-
 Azerbaijan
-
 Bahamas
-
 Bahrain
-
 Bangladesh
-
 Belarus
-
 Belgium
-
 Bolivia
-
 Botswana
-
 Brazil
-
 Brunei
-
 Bulgaria
-
 Cambodia
-
 Cameroon
-
 Canada
-
 Chile
-
 China
-
 Colombia
-
 Congo
-
 Costa Rica
-
 Cote d'Ivoire
-
 Croatia
-
 Cuba
-
 Cyprus
-
 Czechia
-
 DR Congo
-
 Denmark
-
 Dominican Republic
-
 Ecuador
-
 Egypt
-
 El Salvador
-
 Estonia
-
 Eswatini
-
 Ethiopia
-
 Finland
-
 France
-
 Georgia
-
 Germany
-
 Ghana
-
 Greece
-
 Haiti
-
 Hong Kong
-
 Hungary
-
 India
-
 Indonesia
-
 Iran, Islamic republic
-
 Iraq
-
 Ireland
-
 Israel
-
 Italy
-
 Jamaica
-
 Japan
-
 Jordan
-
 Kazakhstan
-
 Kenya
-
 Korea
-
 Kuwait
-
 Kyrgyzstan
-
 Laos
-
 Latvia
-
 Lebanon
-
 Lesotho
-
 Libya
-
 Lithuania
-
 Luxembourg
-
 Madagascar
-
 Malaysia
-
 Malta
-
 Mauritius
-
 Mexico
-
 Moldova
-
 Mongolia
-
 Montenegro
-
 Morocco
-
 Mozambique
-
 Myanmar
-
 Namibia
-
 Nepal
-
 Netherlands
-
 New Zealand
-
 Nigeria
-
 North Macedonia
-
 Norway
-
 Oman
-
 Pakistan
-
 Palestine
-
 Panama
-
 Papua New Guinea
-
 Paraguay
-
 Peru
-
 Philippines
-
 Poland
-
 Portugal
-
 Puerto Rico
-
 Qatar
-
 Reunion
-
 Romania
-
 Rwanda
-
 Saudi Arabia
-
 Serbia
-
 Singapore
-
 Slovakia
-
 Slovenia
-
 Somalia
-
 South Africa
-
 Spain
-
 Sri Lanka
-
 Sweden
-
 Switzerland
-
 Syria
-
 Taiwan
-
 Tajikistan
-
 Tanzania
-
 Thailand
-
 Trinidad and Tobago
-
 Tunisia
-
 Turkey
-
 UAE
-
 Uganda
-
 Ukraine
-
 United Kingdom
-
United States
-
 Uruguay
-
 Uzbekistan
-
 Venezuela
-
 Vietnam
-
 Yemen
-
 Zambia
-
 Zimbabwe
- Forex
- Crypto












