

SNDL stock price prediction: Likely to stabilize as volatility tightens within recent range

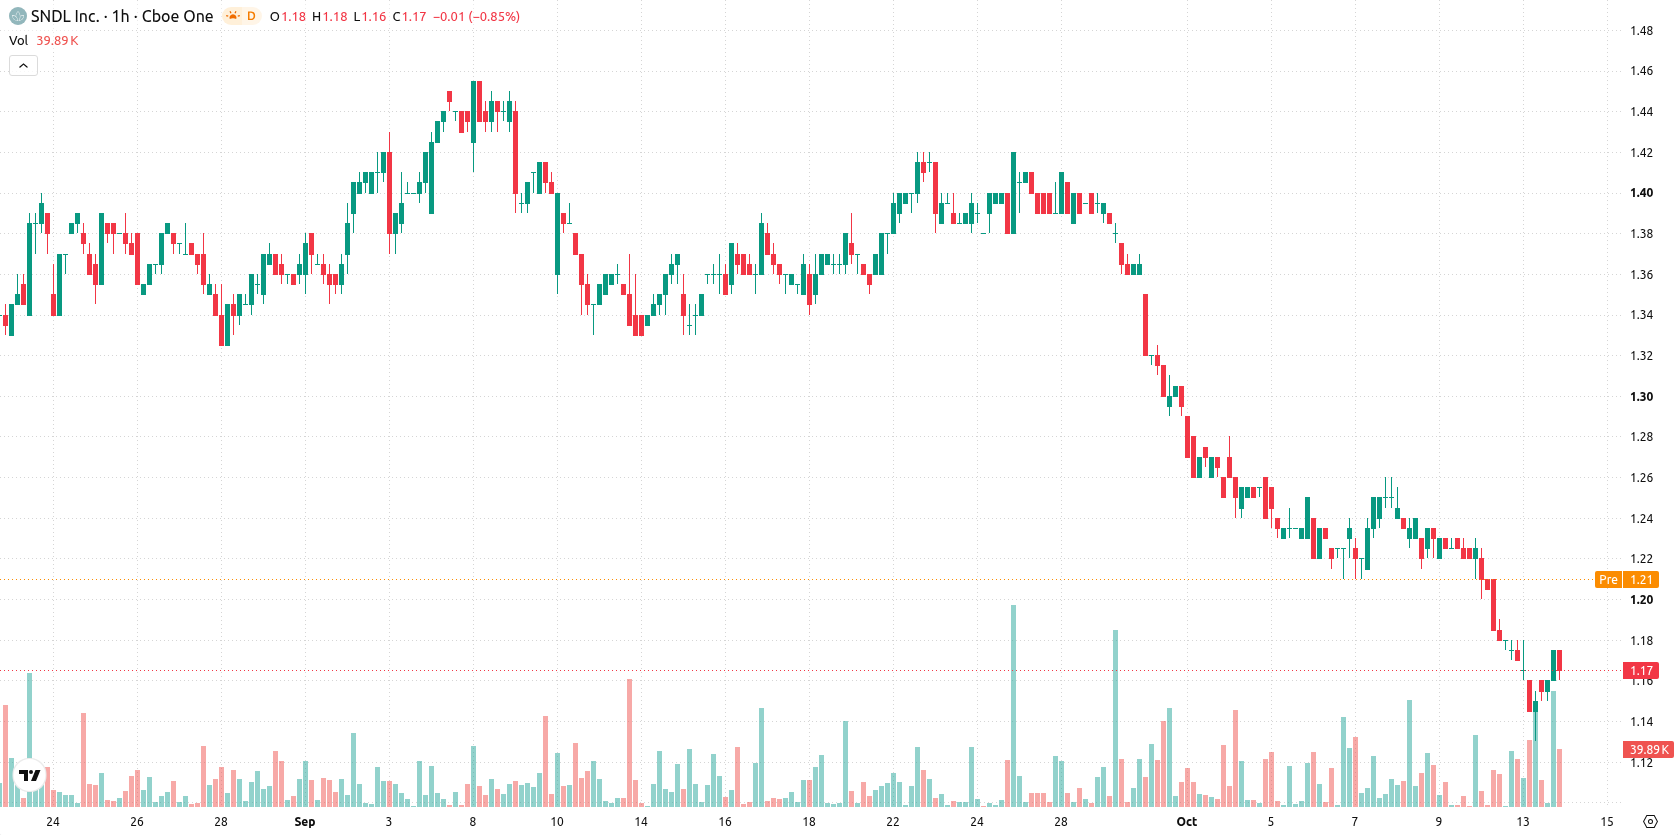
SNDL Inc. (SNDL) stock is trading at $1.16 after a modest decline for the day. The share price sits below its key moving averages, reflecting sustained pressure in recent sessions.
 1.39
1.42
Highlights
- SNDL stock trades below key short-, medium-, and long-term moving averages, confirming persistent downward pressure across timeframes.
- Short-term momentum indicators remain bearish, with both MACD and ADX generating sell signals and RSI deep in the lower range.
- SNDL is likely to move between $1.10 and $1.22 over the next 2 to 3 days, with further declines more probable than a rebound.
Multiple technical signals diverge as downside momentum persists
SNDL is trading below the MA-20 at $1.19 and the MA-50 at $1.22 on the hourly chart, with both levels above the current price. The longer-term MA-200 sits even higher at $1.42, marking a significant overhead threshold. The Ichimoku Kijun is aligned at $1.19 and presents immediate resistance. MACD and ADX both indicate sell conditions. RSI is at 37.35, pointing to continued selling pressure, while Stoch RSI has moved into overbought territory. CCI also signals sell, but Bull/Bear Power is leaning bullish, and the Awesome Oscillator remains neutral, showing some divergence among momentum and oscillator signals.
Downside bias increases as support tests drive volatility
In the short term, SNDL is likely to fluctuate within a range of $1.10 to $1.22, reflecting recent volatility. The probability of a sustained upward move is low, while further downside is more likely if support is breached. The base case is stabilization in this narrow corridor, but any move above resistance could trigger a rebound, whereas a breakdown below support increases the risk of continued declines.
Earlier, analysts noted that SNDL was experiencing persistent bearish momentum reinforced by multiple technical indicators. The latest analysis affirms this ongoing pressure but highlights increasing divergence among oscillators, suggesting that traders should closely monitor for shifts in momentum that could alter the prevailing range-bound scenario.










-
 Afghanistan
-
 Albania
-
 Algeria
-
 Angola
-
 Argentina
-
 Armenia
-
 Australia
-
 Austria
-
 Azerbaijan
-
 Bahamas
-
 Bahrain
-
 Bangladesh
-
 Belarus
-
 Belgium
-
 Bolivia
-
 Botswana
-
 Brazil
-
 Brunei
-
 Bulgaria
-
 Cambodia
-
 Cameroon
-
 Canada
-
 Chile
-
 China
-
 Colombia
-
 Congo
-
 Costa Rica
-
 Cote d'Ivoire
-
 Croatia
-
 Cuba
-
 Cyprus
-
 Czechia
-
 DR Congo
-
 Denmark
-
 Dominican Republic
-
 Ecuador
-
 Egypt
-
 El Salvador
-
 Estonia
-
 Eswatini
-
 Ethiopia
-
 Finland
-
 France
-
 Georgia
-
 Germany
-
 Ghana
-
 Greece
-
 Haiti
-
 Hong Kong
-
 Hungary
-
 India
-
 Indonesia
-
 Iran, Islamic republic
-
 Iraq
-
 Ireland
-
 Israel
-
 Italy
-
 Jamaica
-
 Japan
-
 Jordan
-
 Kazakhstan
-
 Kenya
-
 Korea
-
 Kuwait
-
 Kyrgyzstan
-
 Laos
-
 Latvia
-
 Lebanon
-
 Lesotho
-
 Libya
-
 Lithuania
-
 Luxembourg
-
 Madagascar
-
 Malaysia
-
 Malta
-
 Mauritius
-
 Mexico
-
 Moldova
-
 Mongolia
-
 Montenegro
-
 Morocco
-
 Mozambique
-
 Myanmar
-
 Namibia
-
 Nepal
-
 Netherlands
-
 New Zealand
-
 Nigeria
-
 North Macedonia
-
 Norway
-
 Oman
-
 Pakistan
-
 Palestine
-
 Panama
-
 Papua New Guinea
-
 Paraguay
-
 Peru
-
 Philippines
-
 Poland
-
 Portugal
-
 Puerto Rico
-
 Qatar
-
 Reunion
-
 Romania
-
 Rwanda
-
 Saudi Arabia
-
 Serbia
-
 Singapore
-
 Slovakia
-
 Slovenia
-
 Somalia
-
 South Africa
-
 Spain
-
 Sri Lanka
-
 Sweden
-
 Switzerland
-
 Syria
-
 Taiwan
-
 Tajikistan
-
 Tanzania
-
 Thailand
-
 Trinidad and Tobago
-
 Tunisia
-
 Turkey
-
 UAE
-
 Uganda
-
 Ukraine
-
 United Kingdom
-
United States
-
 Uruguay
-
 Uzbekistan
-
 Venezuela
-
 Vietnam
-
 Yemen
-
 Zambia
-
 Zimbabwe
- Forex
- Crypto












