

Will TELUS stock hold above C$11.18 support amid high volatility?

TELUS (T) stock is trading at C$11.31, posting a modest decline today. The price sits just above its key short-term moving average, while slightly below intermediate and well under long-term averages.
 11.98
12.03
11.98
12.03
Highlights
- TELUS stock will reduce its dividend by 55% and use more cash to pay down debt for balance sheet flexibility.
- The company is advancing in telecom technology with a completed satellite-to-smartphone test and a new AI enterprise partnership.
- Shares trade at C$11.31 with mixed momentum signals, remaining in a short-term C$11.06 to C$11.56 range as volatility persists.
Dividend reduction and tech expansion redefine strategy against shifting investor base
TELUS's decision to implement a 55% dividend cut and redirect cash flow toward debt reduction represents a major shift in capital allocation strategy, as reported by PR Newswire. This move is aimed at improving balance sheet flexibility and addressing leverage, although it may change the stock’s appeal to income-focused investors. The company is also expanding technological capabilities, having completed a satellite-to-smartphone test with AST SpaceMobile to demonstrate new service offerings, according to Kalkinemedia, and launching an enterprise AI partnership with Parloa. Combined, these actions reflect TELUS's focus on financial stability and service innovation against a mixed trading backdrop.
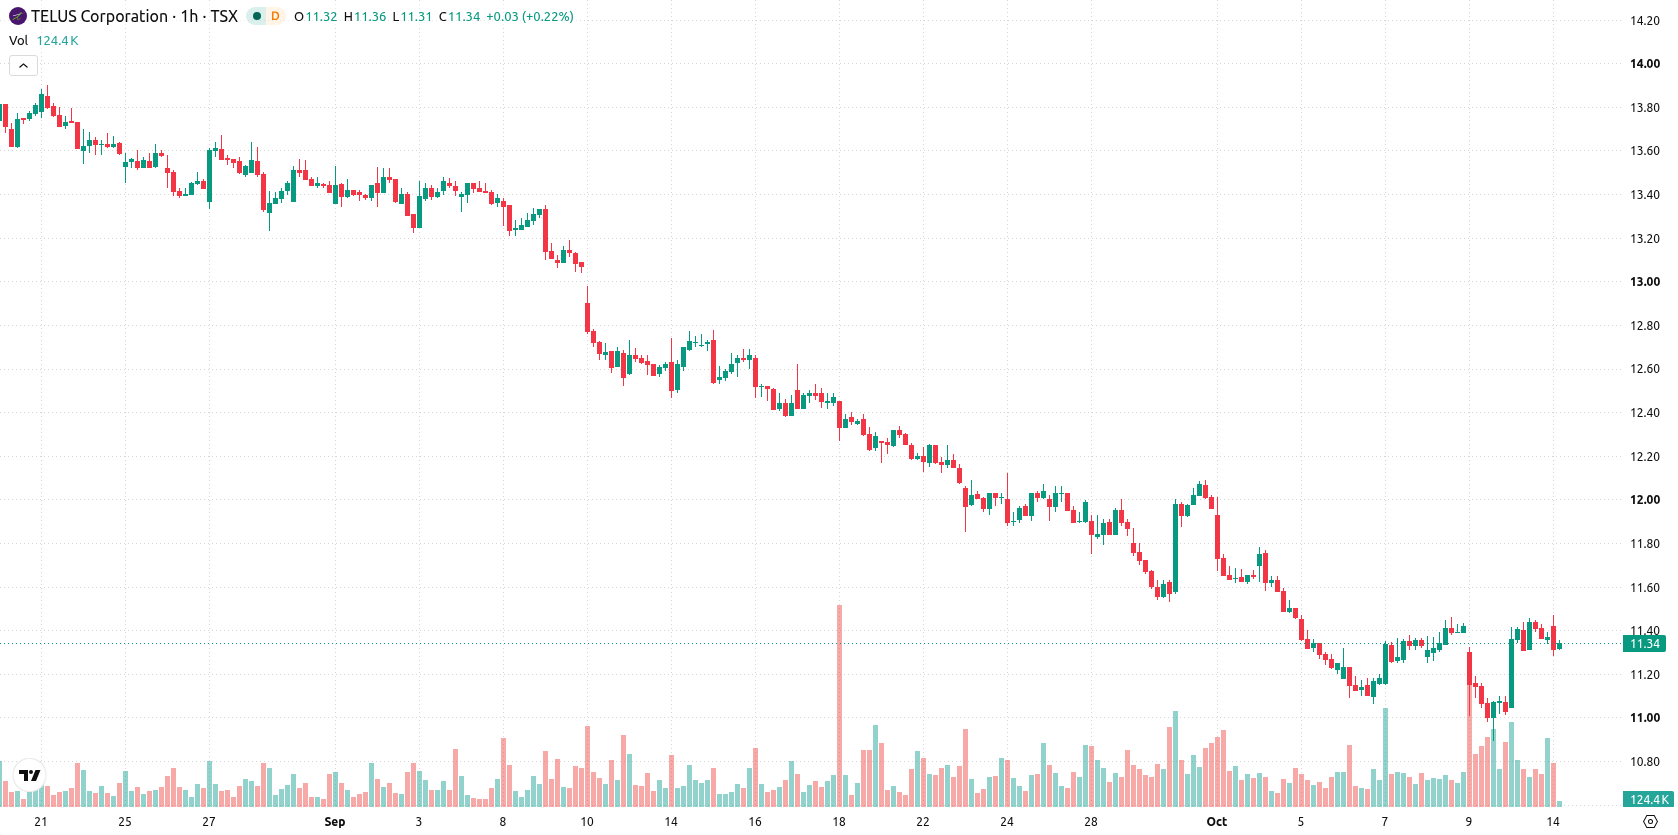
Support at kijun as momentum signals diverge near moving averages
On the technical side, T is currently trading just above the MA-20 at C$11.27, but remains marginally below the MA-50 at C$11.32 and well under the MA-200 at C$16.17. The Ichimoku Kijun provides immediate support at C$11.18. Momentum readings are mixed: RSI stands at 53.25 and ADX points to buy signals; meanwhile, MACD and CCI are neutral, Stochastic RSI is overbought, and Bull/Bear Power reflects intraday buyer dominance with conflicting cues from other oscillators.
Sideways movement forecast as volatility balances breakout risk
In the short term, T is expected to trade within a corridor between C$11.06 and C$11.56, consistent with its current high volatility. The probability of an upward or downward move is balanced at 50% each, leading to a baseline scenario of continued sideways movement within this band. A bullish development would require a break above immediate resistance, while a violation of the C$11.18 support level could activate a bearish path.
Earlier, analysts noted that TELUS faced ongoing fundamental and technical challenges, with consolidation dominating its outlook. The current assessment adds a dimension with recent capital allocation shifts and new technology initiatives, positioning C$11.18 as a critical support level to monitor for signs of a potential breakout or renewed downside risk.










-
 Afghanistan
-
 Albania
-
 Algeria
-
 Angola
-
 Argentina
-
 Armenia
-
 Australia
-
 Austria
-
 Azerbaijan
-
 Bahamas
-
 Bahrain
-
 Bangladesh
-
 Belarus
-
 Belgium
-
 Bolivia
-
 Botswana
-
 Brazil
-
 Brunei
-
 Bulgaria
-
 Cambodia
-
 Cameroon
-
 Canada
-
 Chile
Chile
-
 China
China
-
 Colombia
-
 Congo
Congo
-
 Costa Rica
-
 Cote d'Ivoire
-
 Croatia
-
 Cuba
Cuba
-
 Cyprus
-
 Czechia
-
 DR Congo
-
 Denmark
-
 Dominican Republic
-
 Ecuador
-
 Egypt
Egypt
-
 El Salvador
-
 Estonia
-
 Eswatini
-
 Ethiopia
-
 Finland
-
 France
-
 Georgia
-
 Germany
-
 Ghana
Ghana
-
 Greece
-
 Haiti
Haiti
-
 Hong Kong
-
 Hungary
-
 India
India
-
 Indonesia
-
 Iran, Islamic republic
-
 Iraq
Iraq
-
 Ireland
-
 Israel
-
 Italy
Italy
-
 Jamaica
-
 Japan
Japan
-
 Jordan
-
 Kazakhstan
-
 Kenya
Kenya
-
 Korea
Korea
-
 Kuwait
-
 Kyrgyzstan
-
 Laos
Laos
-
 Latvia
-
 Lebanon
-
 Lesotho
-
 Libya
Libya
-
 Lithuania
-
 Luxembourg
-
 Madagascar
-
 Malaysia
-
 Malta
Malta
-
 Mauritius
-
 Mexico
-
 Moldova
-
 Mongolia
-
 Montenegro
-
 Morocco
-
 Mozambique
-
 Myanmar
-
 Namibia
-
 Nepal
Nepal
-
 Netherlands
-
 New Zealand
-
 Nigeria
-
 North Macedonia
-
 Norway
-
 Oman
Oman
-
 Pakistan
-
 Palestine
-
 Panama
-
 Papua New Guinea
-
 Paraguay
-
 Peru
Peru
-
 Philippines
-
 Poland
-
 Portugal
-
 Puerto Rico
-
 Qatar
Qatar
-
 Reunion
-
 Romania
-
 Rwanda
-
 Saudi Arabia
-
 Serbia
-
 Singapore
-
 Slovakia
-
 Slovenia
-
 Somalia
-
 South Africa
-
 Spain
Spain
-
 Sri Lanka
-
 Sweden
-
 Switzerland
-
 Syria
Syria
-
 Taiwan
-
 Tajikistan
-
 Tanzania
-
 Thailand
-
 Trinidad and Tobago
-
 Tunisia
-
 Turkey
-
 UAE
UAE
-
 Uganda
-
 Ukraine
-
 United Kingdom
-
United States
-
 Uruguay
-
 Uzbekistan
-
 Venezuela
-
 Vietnam
-
 Yemen
Yemen
-
 Zambia
-
 Zimbabwe
- Forex
- Crypto












