

Telus stock remains range-bound as buyer support holds above C$11.46

Telus (T) stock is trading at C$11.87 after a modest daily rise. The price holds above its key short- and medium-term moving averages but remains some distance below the long-term benchmark, suggesting mixed positioning across time frames.
 11.98
12.03
Highlights
- TELUS stock reduced its quarterly dividend by 55%, freeing up capital for debt repayment and long-term growth.
- TELUS Digital partnered with Parloa to deploy AI agents for enterprise customer service, supporting operational efficiency initiatives.
- TELUS stock trades with near-term bullish momentum but faces long-term resistance, with a 2 to 3 day expected range of C$11.44 to C$12.3.
Dividend reset and AI expansion as capital deployed for resilience
TELUS's recent decision to reset its quarterly dividend, reducing it by 55%, immediately frees capital that can be redirected toward debt reduction and long-term growth, improving the company’s financial resilience, as reported by Fool. In parallel, TELUS Digital’s partnership with Parloa to introduce AI agents for enterprise customer service enhances digital solutions and supports future operational efficiencies, according to Kalkinemedia. The company has also set October 30, 2026, as the date for its Q3 2026 earnings update, per Investing.com, providing investors with a timeline for the next financial disclosure.
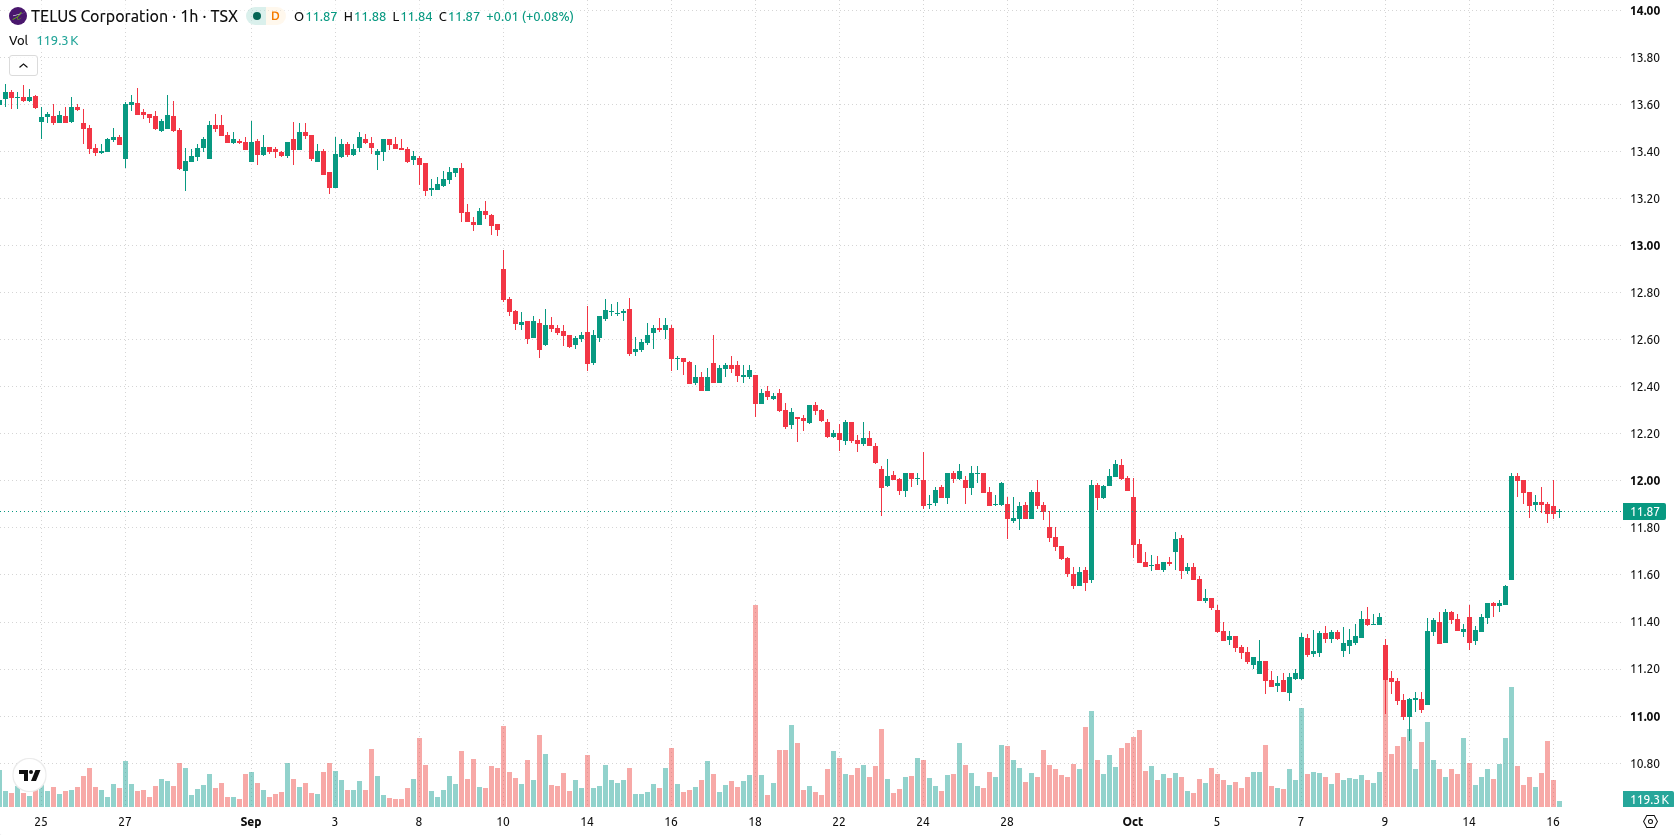
Buy momentum builds as price holds key supports amid caution
On the technical side, T trades above the MA-20 at C$11.59 and MA-50 at C$11.38, but remains well below the MA-200 at C$16.11 on the daily chart. The Ichimoku Kijun at C$11.46 acts as immediate support. Momentum indicators on the hourly chart are largely constructive: MACD and ADX both indicate Buy signals, while Bull/Bear Power shows strength from buyers. RSI reads 65, also in Buy territory, with CCI confirming buyer dominance. However, Stochastic RSI and the Awesome Oscillator are both Neutral, highlighting some underlying market indecision and suggesting the need for caution.
Upside favored as volatility band sets trading corridor
Over the next two to three trading days, the expected price corridor for T is C$11.44 to C$12.3, representing a typical volatility band relative to current levels. Probabilistically, there is a 73% chance of movement toward the upside, compared to a 27% probability of a downside move. The base scenario anticipates consolidation within this range. Should bullish momentum accelerate, a move toward C$12.3 is plausible, while a breach below the C$11.46 support could target the lower band of the forecast.
Earlier, analysts highlighted that while digital partnerships and innovation had spurred near-term strength for Telus, the stock’s longer-term trajectory depended on overcoming resistance levels. The current analysis adds that in light of Telus's dividend reset and constructive technical signals, investors should particularly monitor the C$11.46 support, as a decisive move below this level could signal the onset of deeper short-term downside risk.









-
 Afghanistan
-
 Albania
-
 Algeria
-
 Angola
-
 Argentina
-
 Armenia
-
 Australia
-
 Austria
-
 Azerbaijan
-
 Bahamas
-
 Bahrain
-
 Bangladesh
-
 Belarus
-
 Belgium
-
 Bolivia
-
 Botswana
-
 Brazil
-
 Brunei
-
 Bulgaria
-
 Cambodia
-
 Cameroon
-
 Canada
-
 Chile
-
 China
-
 Colombia
-
 Congo
-
 Costa Rica
-
 Cote d'Ivoire
-
 Croatia
-
 Cuba
-
 Cyprus
-
 Czechia
-
 DR Congo
-
 Denmark
-
 Dominican Republic
-
 Ecuador
-
 Egypt
-
 El Salvador
-
 Estonia
-
 Eswatini
-
 Ethiopia
-
 Finland
-
 France
-
 Georgia
-
 Germany
-
 Ghana
-
 Greece
-
 Haiti
-
 Hong Kong
-
 Hungary
-
 India
-
 Indonesia
-
 Iran, Islamic republic
-
 Iraq
-
 Ireland
-
 Israel
-
 Italy
-
 Jamaica
-
 Japan
-
 Jordan
-
 Kazakhstan
-
 Kenya
-
 Korea
-
 Kuwait
-
 Kyrgyzstan
-
 Laos
-
 Latvia
-
 Lebanon
-
 Lesotho
-
 Libya
-
 Lithuania
-
 Luxembourg
-
 Madagascar
-
 Malaysia
-
 Malta
-
 Mauritius
-
 Mexico
-
 Moldova
-
 Mongolia
-
 Montenegro
-
 Morocco
-
 Mozambique
-
 Myanmar
-
 Namibia
-
 Nepal
-
 Netherlands
-
 New Zealand
-
 Nigeria
-
 North Macedonia
-
 Norway
-
 Oman
-
 Pakistan
-
 Palestine
-
 Panama
-
 Papua New Guinea
-
 Paraguay
-
 Peru
-
 Philippines
-
 Poland
-
 Portugal
-
 Puerto Rico
-
 Qatar
-
 Reunion
-
 Romania
-
 Rwanda
-
 Saudi Arabia
-
 Serbia
-
 Singapore
-
 Slovakia
-
 Slovenia
-
 Somalia
-
 South Africa
-
 Spain
-
 Sri Lanka
-
 Sweden
-
 Switzerland
-
 Syria
-
 Taiwan
-
 Tajikistan
-
 Tanzania
-
 Thailand
-
 Trinidad and Tobago
-
 Tunisia
-
 Turkey
-
 UAE
-
 Uganda
-
 Ukraine
-
 United Kingdom
-
United States
-
 Uruguay
-
 Uzbekistan
-
 Venezuela
-
 Vietnam
-
 Yemen
-
 Zambia
-
 Zimbabwe
- Forex
- Crypto












