

Will SNDL stock hold above $1.10 support as seller pressure builds?

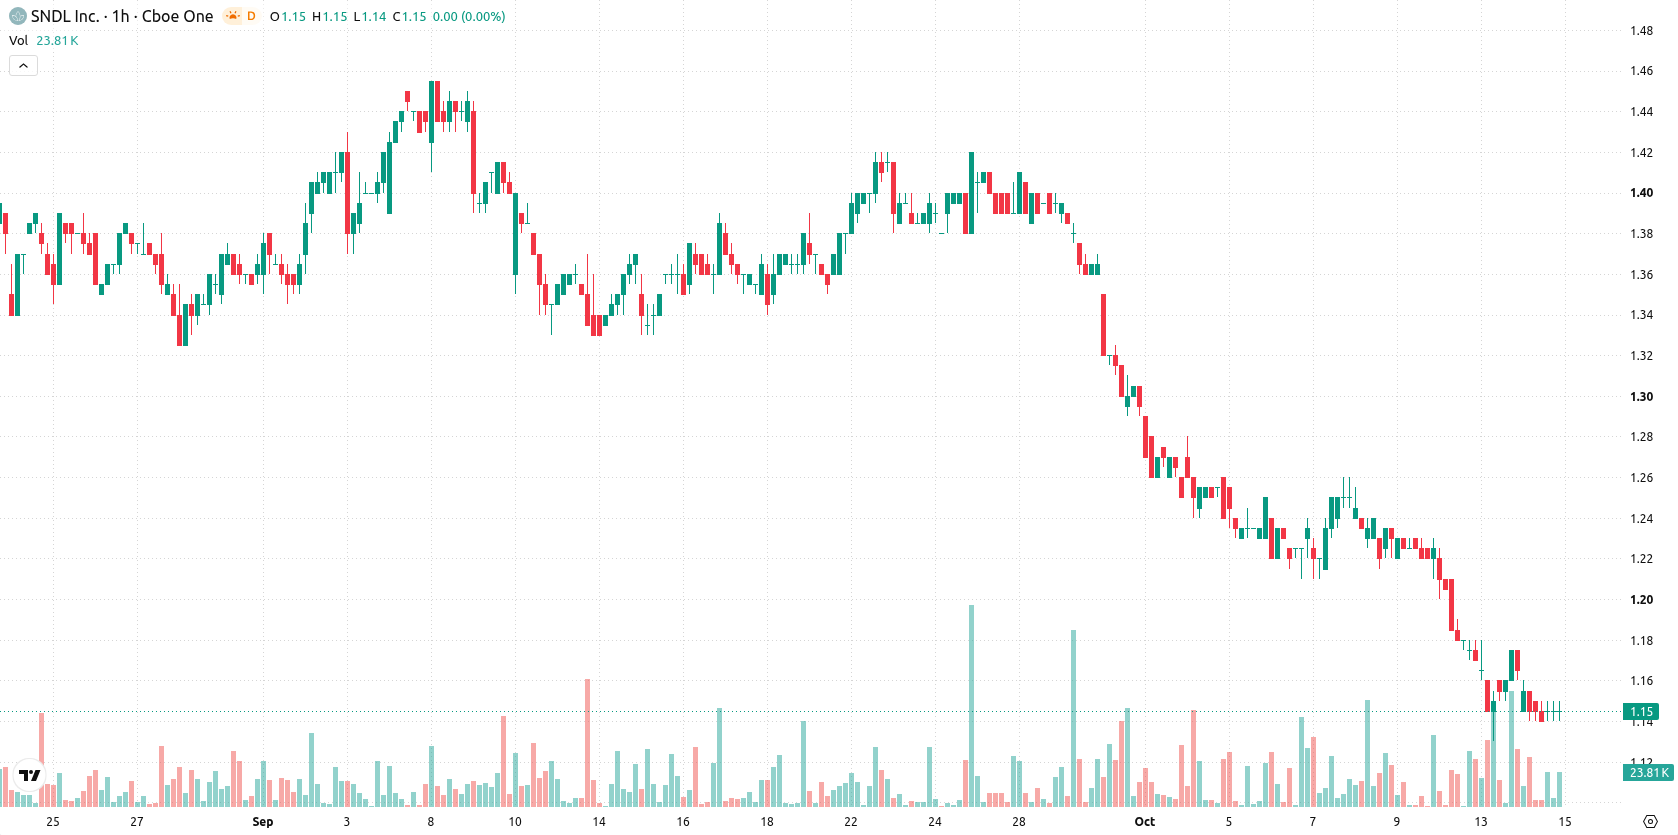
SNDL Inc. (SNDL) stock is trading at $1.15 today, logging a slight decline on the session. The price sits below its key moving averages, reflecting ongoing downward momentum.
 1.39
1.42
Highlights
- SNDL/USD stays below key short- and long-term moving averages, confirming pervasive selling pressure across all timeframes.
- Momentum and volatility indicators consistently signal a bearish trend, with support concentrated around $1.10 and resistance at $1.18.
- The forecast expects SNDL/USD to trade between $1.10 and $1.20, with a 75% probability of continued downside and only 25% probability for upside.
Technical barriers build as weak momentum reinforces sell signals
On the hourly chart, SNDL is trading below its MA-20, MA-50, and MA-200, placing it beneath key technical levels. The Ichimoku Kijun is set at $1.18 and currently represents immediate resistance. Momentum is weak: MACD and ADX both register strong sell readings, while RSI is 31.55, staying in the sell region. CCI is moving lower and Stoch RSI is neutral, pointing to mild oversold conditions without a clear reversal. Bull/Bear Power favors sellers, with Awesome Oscillator neutral and providing no directional signal.
Range-bound outlook persists amid low upside recovery odds
Looking forward, SNDL is forecast to stay within a $1.10 to $1.20 range over the coming days, reflecting typical volatility for the stock. There is a 25% probability of a rebound above $1.18, which would indicate a potential short-term recovery. However, the dominant scenario remains a continuation of the current range, with a stronger likelihood—75%—of further downside if $1.10 is breached.
Earlier, analysts noted that SNDL was weighed down by persistent bearish momentum across multiple technical indicators. The current analysis not only reaffirms this downside bias but also highlights $1.10 as a critical support level that, if breached, could accelerate further declines.









-
 Afghanistan
-
 Albania
-
 Algeria
-
 Angola
-
 Argentina
-
 Armenia
-
 Australia
-
 Austria
-
 Azerbaijan
-
 Bahamas
-
 Bahrain
-
 Bangladesh
-
 Belarus
-
 Belgium
-
 Bolivia
-
 Botswana
-
 Brazil
-
 Brunei
-
 Bulgaria
-
 Cambodia
-
 Cameroon
-
 Canada
-
 Chile
-
 China
-
 Colombia
-
 Congo
-
 Costa Rica
-
 Cote d'Ivoire
-
 Croatia
-
 Cuba
-
 Cyprus
-
 Czechia
-
 DR Congo
-
 Denmark
-
 Dominican Republic
-
 Ecuador
-
 Egypt
-
 El Salvador
-
 Estonia
-
 Eswatini
-
 Ethiopia
-
 Finland
-
 France
-
 Georgia
-
 Germany
-
 Ghana
-
 Greece
-
 Haiti
-
 Hong Kong
-
 Hungary
-
 India
-
 Indonesia
-
 Iran, Islamic republic
-
 Iraq
-
 Ireland
-
 Israel
-
 Italy
-
 Jamaica
-
 Japan
-
 Jordan
-
 Kazakhstan
-
 Kenya
-
 Korea
-
 Kuwait
-
 Kyrgyzstan
-
 Laos
-
 Latvia
-
 Lebanon
-
 Lesotho
-
 Libya
-
 Lithuania
-
 Luxembourg
-
 Madagascar
-
 Malaysia
-
 Malta
-
 Mauritius
-
 Mexico
-
 Moldova
-
 Mongolia
-
 Montenegro
-
 Morocco
-
 Mozambique
-
 Myanmar
-
 Namibia
-
 Nepal
-
 Netherlands
-
 New Zealand
-
 Nigeria
-
 North Macedonia
-
 Norway
-
 Oman
-
 Pakistan
-
 Palestine
-
 Panama
-
 Papua New Guinea
-
 Paraguay
-
 Peru
-
 Philippines
-
 Poland
-
 Portugal
-
 Puerto Rico
-
 Qatar
-
 Reunion
-
 Romania
-
 Rwanda
-
 Saudi Arabia
-
 Serbia
-
 Singapore
-
 Slovakia
-
 Slovenia
-
 Somalia
-
 South Africa
-
 Spain
-
 Sri Lanka
-
 Sweden
-
 Switzerland
-
 Syria
-
 Taiwan
-
 Tajikistan
-
 Tanzania
-
 Thailand
-
 Trinidad and Tobago
-
 Tunisia
-
 Turkey
-
 UAE
-
 Uganda
-
 Ukraine
-
 United Kingdom
-
United States
-
 Uruguay
-
 Uzbekistan
-
 Venezuela
-
 Vietnam
-
 Yemen
-
 Zambia
-
 Zimbabwe
- Forex
- Crypto












