

Royal Bank of Canada stock stays flat as buyers defend C$273.8 support

Royal Bank of Canada (RY) stock is trading at C$275.3, registering a slight daily decline. The price remains above its key short-term average but sits below the mid-term average, and is well supported on longer timeframes.
 281.79
Highlights
- Royal Bank of Canada completed a C$500 million four-year Indigenous Bond issuance to finance projects for Indigenous communities and businesses.
- This bond issue expands the bank's funding sources and aims to support broader economic participation for Indigenous stakeholders.
- Royal Bank of Canada stock is trading at C$275.3 above its 200-day average, with bullish technical indicators suggesting a 71% probability of remaining in the C$272.09 to C$278.51 range over the next 2 to 3 days.
New Indigenous bond and technical crossover broaden funding, fuel sentiment
Royal Bank of Canada has completed a C$500 million four-year callable Indigenous Bond issue as part of its Sustainable Bond Framework, aiming to direct proceeds toward lending and investment initiatives for Indigenous communities and businesses. This transaction expands the bank's funding base and supports inclusive economic participation, potentially strengthening long-term relationships throughout key markets. In addition, Royal Bank of Canada (TSE:RY) stock crossed above its 200-day moving average, a technical event that may attract additional investor interest, according to MarketBeat.
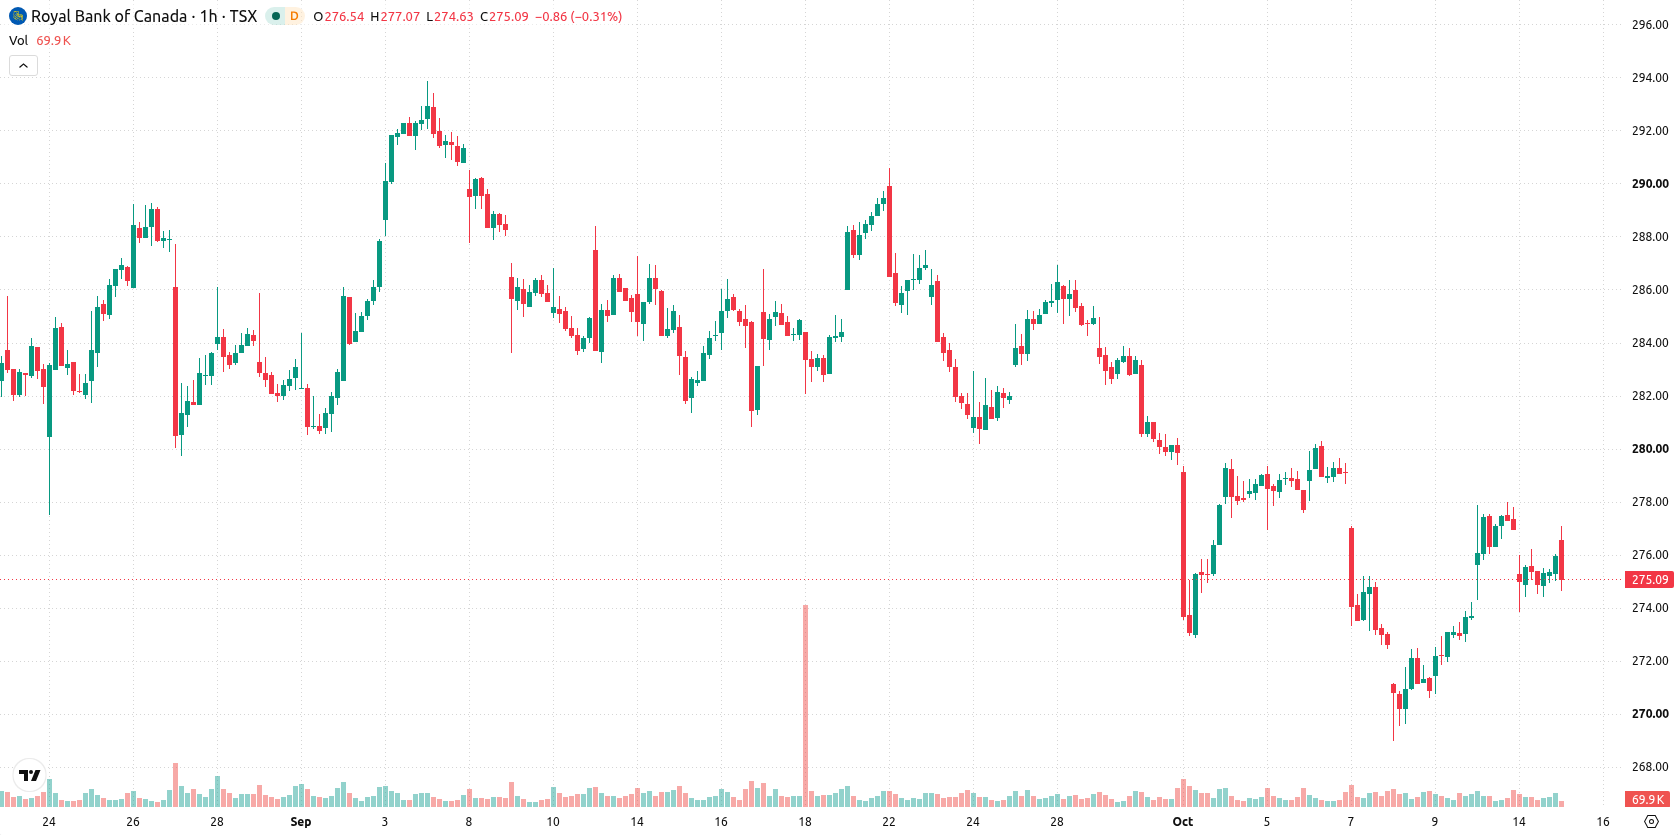
Strengthening momentum as support holds amid overbought signals
C$273.8 acts as immediate support, marked by the Ichimoku Kijun line. On the hourly chart, the price remains above the MA-20 but below the MA-50, while on the daily timeframe it trades well above the MA-200. MACD signals a strong buy, whereas ADX is neutral, reflecting momentum is strengthening with only moderate trend conviction. RSI at 54.52 and Stochastic RSI suggest mild bullishness, while CCI is neutral. Bull/Bear Power is classified as overbought, highlighting persistent buyer dominance intraday. The Awesome Oscillator confirms prevailing buy momentum, though price action settled near the session low, suggesting near-term resistance could emerge.
Upward bias prevails as price stays within volatility range
Over the next 2–3 trading days, RY is likely to fluctuate between C$272.09 and C$278.51, reflecting a typical volatility band relative to current levels. The probability of an upward move stands at 71%, with a downward scenario less likely at 29%. Barring any breakout, the price is expected to remain anchored within this established range, with a decisive move above resistance required for a bullish extension or a drop below immediate support setting up a potential pullback.
Earlier, analysts noted that Royal Bank of Canada shares were exhibiting technical resilience amid mixed momentum signals and elevated short interest, warranting caution. The current analysis adds a new dimension with confirmation of strengthening momentum and recent upside technical events, making immediate support at C$273.8 a key level to watch for trend continuation or reversal.









-
 Afghanistan
-
 Albania
-
 Algeria
-
 Angola
-
 Argentina
-
 Armenia
-
 Australia
-
 Austria
-
 Azerbaijan
-
 Bahamas
-
 Bahrain
-
 Bangladesh
-
 Belarus
-
 Belgium
-
 Bolivia
-
 Botswana
-
 Brazil
-
 Brunei
-
 Bulgaria
-
 Cambodia
-
 Cameroon
-
 Canada
-
 Chile
-
 China
-
 Colombia
-
 Congo
-
 Costa Rica
-
 Cote d'Ivoire
-
 Croatia
-
 Cuba
-
 Cyprus
-
 Czechia
-
 DR Congo
-
 Denmark
-
 Dominican Republic
-
 Ecuador
-
 Egypt
-
 El Salvador
-
 Estonia
-
 Eswatini
-
 Ethiopia
-
 Finland
-
 France
-
 Georgia
-
 Germany
-
 Ghana
-
 Greece
-
 Haiti
-
 Hong Kong
-
 Hungary
-
 India
-
 Indonesia
-
 Iran, Islamic republic
-
 Iraq
-
 Ireland
-
 Israel
-
 Italy
-
 Jamaica
-
 Japan
-
 Jordan
-
 Kazakhstan
-
 Kenya
-
 Korea
-
 Kuwait
-
 Kyrgyzstan
-
 Laos
-
 Latvia
-
 Lebanon
-
 Lesotho
-
 Libya
-
 Lithuania
-
 Luxembourg
-
 Madagascar
-
 Malaysia
-
 Malta
-
 Mauritius
-
 Mexico
-
 Moldova
-
 Mongolia
-
 Montenegro
-
 Morocco
-
 Mozambique
-
 Myanmar
-
 Namibia
-
 Nepal
-
 Netherlands
-
 New Zealand
-
 Nigeria
-
 North Macedonia
-
 Norway
-
 Oman
-
 Pakistan
-
 Palestine
-
 Panama
-
 Papua New Guinea
-
 Paraguay
-
 Peru
-
 Philippines
-
 Poland
-
 Portugal
-
 Puerto Rico
-
 Qatar
-
 Reunion
-
 Romania
-
 Rwanda
-
 Saudi Arabia
-
 Serbia
-
 Singapore
-
 Slovakia
-
 Slovenia
-
 Somalia
-
 South Africa
-
 Spain
-
 Sri Lanka
-
 Sweden
-
 Switzerland
-
 Syria
-
 Taiwan
-
 Tajikistan
-
 Tanzania
-
 Thailand
-
 Trinidad and Tobago
-
 Tunisia
-
 Turkey
-
 UAE
-
 Uganda
-
 Ukraine
-
 United Kingdom
-
United States
-
 Uruguay
-
 Uzbekistan
-
 Venezuela
-
 Vietnam
-
 Yemen
-
 Zambia
-
 Zimbabwe
- Forex
- Crypto












