

Morgan Stanley stock weekly forecast: Strong earnings fail to spark rebound as oversold setup persists

Shares of Morgan Stanley (MS) are trading near $179 following a decline of nearly 6% over the past week, as strong selling pressure has pushed the stock into deeply oversold conditions. Despite solid earnings, this persistent decline signals caution for the week ahead, with investors watching for signs of stabilization or further downside.
 184.83
193.19
184.83
193.19
Highlights
- Shares of Morgan Stanley fell 5.73% over the past week to $178.65, well below key moving averages.
- The stock shows a persistent downtrend with strong bearish momentum and indicators in oversold territory.
- Immediate support is at $176.44 with projected trading between $163.08 to $186.19 over the next five days and resistance at $193.16.
Earnings beat boosts wealth management but investment banking lags expectations
Morgan Stanley reported strong third-quarter 2026 financial results, beating Wall Street expectations with revenue of $20.34 billion and GAAP earnings per share of $3.03, according to CNBC. The company's wealth management division added $232 billion in new assets, much of it related to robust IPO activity. Although investment banking revenue edged 2% higher to $2.16 billion, it missed analyst forecasts by about $110 million. Morgan Stanley also completed around $1.5 billion in share repurchases and declared a quarterly dividend of $1.15 per share.
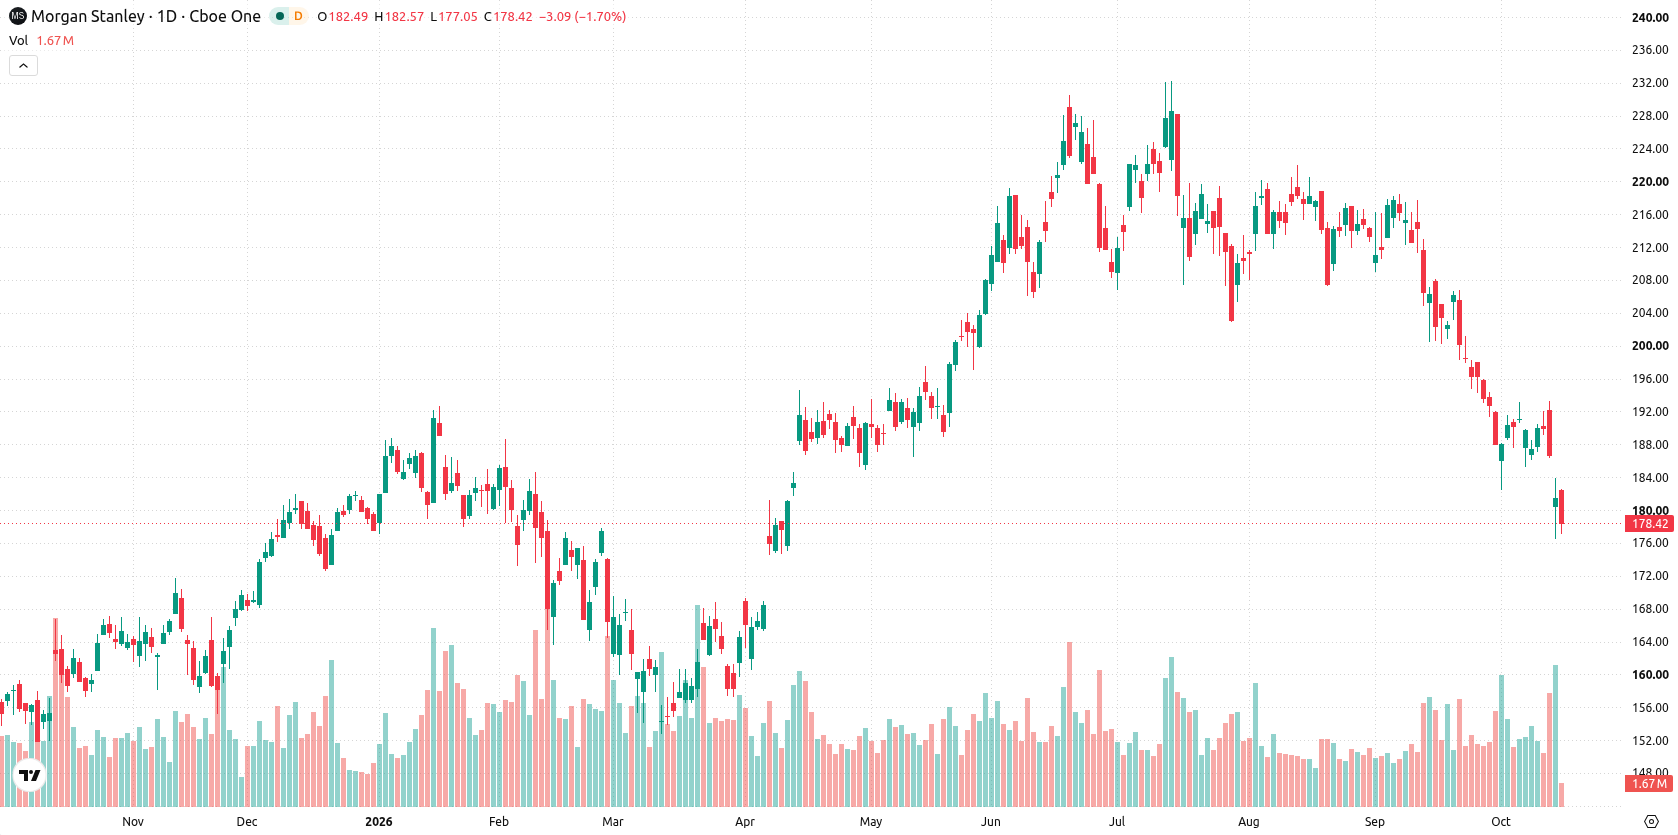
Oversold momentum dominates as technical signals reinforce downside risks
The daily chart shows a sustained move lower with a firm trend, underlined by RSI at 25.47 and CCI at -156.37, both deep in oversold territory. MACD momentum remains negative, adding confirmation to the downside, while the past week's volatility has been elevated at 9.56%. Immediate support stands at $176.44, with resistance at $193.16 and a secondary barrier at the Ichimoku Kijun near $197.04. The overall setup signals persistent selling pressure, with oversold conditions offering scant indication of a near-term bounce.
Further losses likely with downside bias unless key resistance breaks
For the next five trading days, the expected range is $163.08 to $186.19. There is a very high probability (more than 80%) of further declines and a very low probability of an increase. The base case is for the stock to remain pressured below $193.16, with any rebound struggling to clear this resistance. A sustained break above $193.16 could open the door to a recovery attempt, while a drop below $176.44 would expose further downside toward the lower end of the projected range.
Previously it was reported that Morgan Stanley shares faced persistent downside risk amid technical weakness despite solid earnings performance. The latest price action reinforces this bearish outlook, with traders advised to monitor $176.44 as a critical support level that could determine the stock’s near-term direction.




Latest Morgan Stanley News





-
 Afghanistan
-
 Albania
-
 Algeria
-
 Angola
-
 Argentina
-
 Armenia
-
 Australia
-
 Austria
-
 Azerbaijan
-
 Bahamas
-
 Bahrain
-
 Bangladesh
-
 Belarus
-
 Belgium
-
 Bolivia
-
 Botswana
-
 Brazil
-
 Brunei
-
 Bulgaria
-
 Cambodia
-
 Cameroon
-
 Canada
-
 Chile
Chile
-
 China
China
-
 Colombia
-
 Congo
Congo
-
 Costa Rica
-
 Cote d'Ivoire
-
 Croatia
-
 Cuba
Cuba
-
 Cyprus
-
 Czechia
-
 DR Congo
-
 Denmark
-
 Dominican Republic
-
 Ecuador
-
 Egypt
Egypt
-
 El Salvador
-
 Estonia
-
 Eswatini
-
 Ethiopia
-
 Finland
-
 France
-
 Georgia
-
 Germany
-
 Ghana
Ghana
-
 Greece
-
 Haiti
Haiti
-
 Hong Kong
-
 Hungary
-
 India
India
-
 Indonesia
-
 Iran, Islamic republic
-
 Iraq
Iraq
-
 Ireland
-
 Israel
-
 Italy
Italy
-
 Jamaica
-
 Japan
Japan
-
 Jordan
-
 Kazakhstan
-
 Kenya
Kenya
-
 Korea
Korea
-
 Kuwait
-
 Kyrgyzstan
-
 Laos
Laos
-
 Latvia
-
 Lebanon
-
 Lesotho
-
 Libya
Libya
-
 Lithuania
-
 Luxembourg
-
 Madagascar
-
 Malaysia
-
 Malta
Malta
-
 Mauritius
-
 Mexico
-
 Moldova
-
 Mongolia
-
 Montenegro
-
 Morocco
-
 Mozambique
-
 Myanmar
-
 Namibia
-
 Nepal
Nepal
-
 Netherlands
-
 New Zealand
-
 Nigeria
-
 North Macedonia
-
 Norway
-
 Oman
Oman
-
 Pakistan
-
 Palestine
-
 Panama
-
 Papua New Guinea
-
 Paraguay
-
 Peru
Peru
-
 Philippines
-
 Poland
-
 Portugal
-
 Puerto Rico
-
 Qatar
Qatar
-
 Reunion
-
 Romania
-
 Rwanda
-
 Saudi Arabia
-
 Serbia
-
 Singapore
-
 Slovakia
-
 Slovenia
-
 Somalia
-
 South Africa
-
 Spain
Spain
-
 Sri Lanka
-
 Sweden
-
 Switzerland
-
 Syria
Syria
-
 Taiwan
-
 Tajikistan
-
 Tanzania
-
 Thailand
-
 Trinidad and Tobago
-
 Tunisia
-
 Turkey
-
 UAE
UAE
-
 Uganda
-
 Ukraine
-
 United Kingdom
-
United States
-
 Uruguay
-
 Uzbekistan
-
 Venezuela
-
 Vietnam
-
 Yemen
Yemen
-
 Zambia
-
 Zimbabwe
- Forex
- Crypto












