

SOFI climbs as oversold RSI hints at possible upward move

SoFi (SOFI) stock is trading at $14.69, up 3.31% on the day. The price is currently below its key moving averages, reflecting its position relative to short-, medium-, and long-term trends.
 16.56
17.72
Highlights
- SoFi Technologies stock has faced pressure from hotter-than-expected inflation data raising concerns about future interest rates.
- Higher interest rate expectations challenge SoFi's funding costs and loan demand, affecting its main financial services business.
- SoFi stock trades below key moving averages with most technical indicators bearish and a 62% probability of a move down to the $13.83 to $15.55 range.
Inflation-driven rate fears fuel volatility and sector headwinds
SoFi Technologies has been affected by hotter-than-expected inflation data, which is raising concerns over the outlook for interest rates and pressuring sentiment in the banking and fintech sector, according to Yahoo Finance. Rising interest rate expectations can directly impact both funding costs and borrowing demand for SoFi, creating headwinds for its core lending and financial services businesses. This environment has contributed to recent volatility in the stock as investors respond to shifting macroeconomic risks.
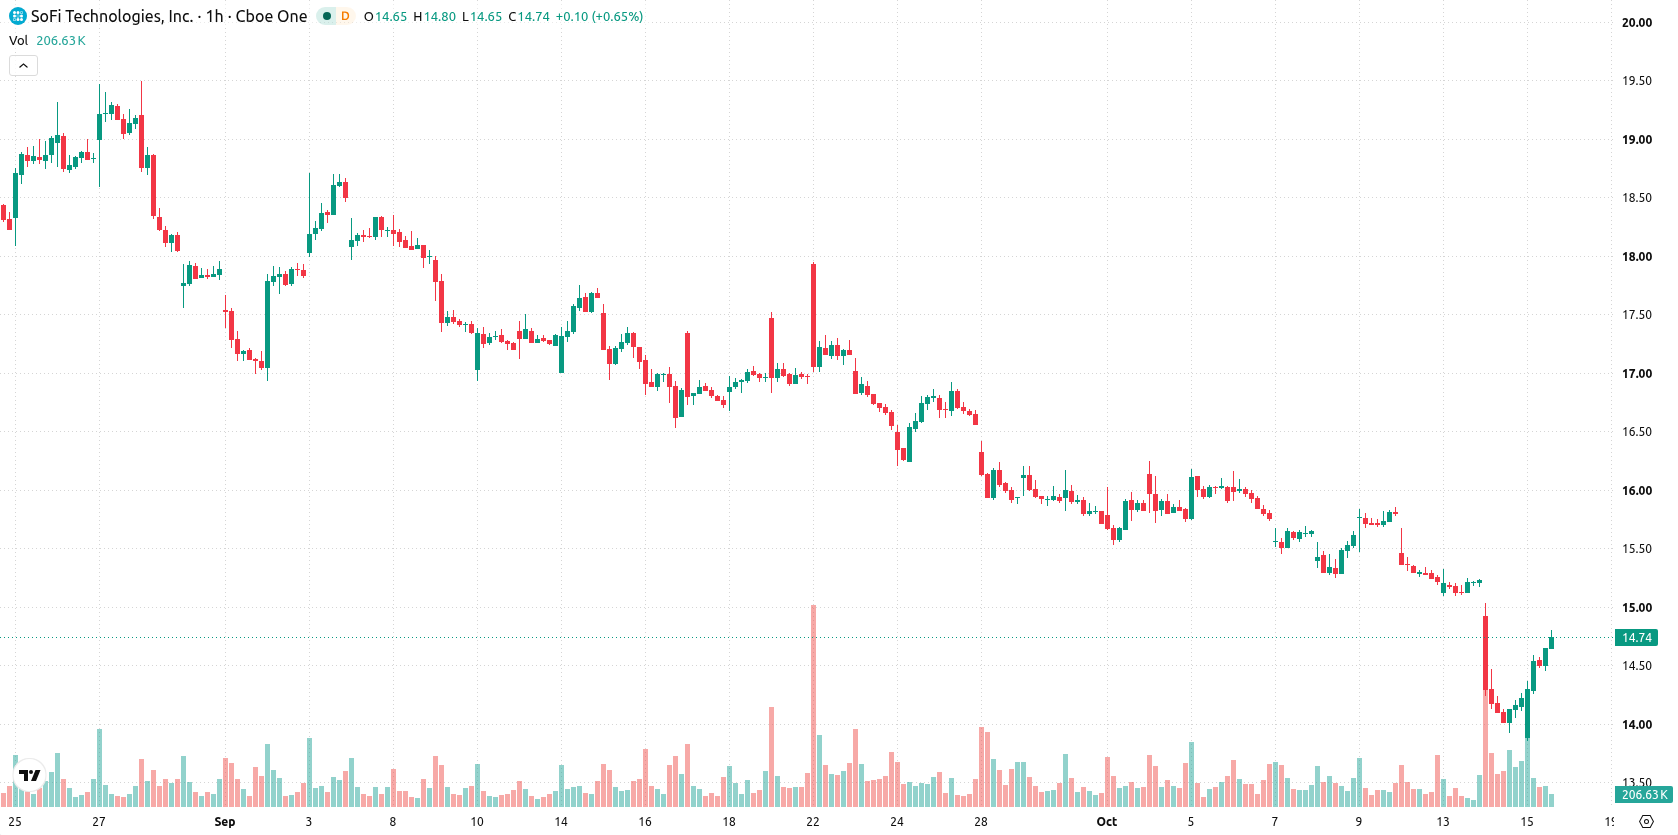
Bearish momentum as SOFI breaks below major technical levels
On the technical front, SOFI is trading below the MA-20 at $14.85, the MA-50 at $15.34, and the MA-200 at $18.49. Immediate resistance is identified at the Ichimoku Kijun level of $14.88. Momentum signals remain largely bearish with MACD and ADX both indicating downside strength. RSI is at 24.35 and deep in oversold territory, while CCI and Bull/Bear Power confirm persistent seller dominance. Stochastic RSI is neutral, but overall, oscillators continue to align on downside momentum.
Downside risk prevails as range-bound trade persists
In the short term, SOFI is likely to trade within a range of $13.83 to $15.55, reflecting typical volatility around current levels. The probability model favors a downside scenario with a 62% chance, while the likelihood of an upside break stands at 38%. A push above $14.88 would open space for a bullish move, but a drop below $13.83 would reinforce the negative outlook.
Previously it was reported that SoFi stock remained in a bearish technical pattern with elevated downside risk amid consolidation. The current analysis reinforces this negative outlook given persistent selling pressure and deep oversold signals, with attention now focused on whether the stock can hold above $13.83 to avoid further declines.










-
 Afghanistan
-
 Albania
-
 Algeria
-
 Angola
-
 Argentina
-
 Armenia
-
 Australia
-
 Austria
-
 Azerbaijan
-
 Bahamas
-
 Bahrain
-
 Bangladesh
-
 Belarus
-
 Belgium
-
 Bolivia
-
 Botswana
-
 Brazil
-
 Brunei
-
 Bulgaria
-
 Cambodia
-
 Cameroon
-
 Canada
-
 Chile
-
 China
-
 Colombia
-
 Congo
-
 Costa Rica
-
 Cote d'Ivoire
-
 Croatia
-
 Cuba
-
 Cyprus
-
 Czechia
-
 DR Congo
-
 Denmark
-
 Dominican Republic
-
 Ecuador
-
 Egypt
-
 El Salvador
-
 Estonia
-
 Eswatini
-
 Ethiopia
-
 Finland
-
 France
-
 Georgia
-
 Germany
-
 Ghana
-
 Greece
-
 Haiti
-
 Hong Kong
-
 Hungary
-
 India
-
 Indonesia
-
 Iran, Islamic republic
-
 Iraq
-
 Ireland
-
 Israel
-
 Italy
-
 Jamaica
-
 Japan
-
 Jordan
-
 Kazakhstan
-
 Kenya
-
 Korea
-
 Kuwait
-
 Kyrgyzstan
-
 Laos
-
 Latvia
-
 Lebanon
-
 Lesotho
-
 Libya
-
 Lithuania
-
 Luxembourg
-
 Madagascar
-
 Malaysia
-
 Malta
-
 Mauritius
-
 Mexico
-
 Moldova
-
 Mongolia
-
 Montenegro
-
 Morocco
-
 Mozambique
-
 Myanmar
-
 Namibia
-
 Nepal
-
 Netherlands
-
 New Zealand
-
 Nigeria
-
 North Macedonia
-
 Norway
-
 Oman
-
 Pakistan
-
 Palestine
-
 Panama
-
 Papua New Guinea
-
 Paraguay
-
 Peru
-
 Philippines
-
 Poland
-
 Portugal
-
 Puerto Rico
-
 Qatar
-
 Reunion
-
 Romania
-
 Rwanda
-
 Saudi Arabia
-
 Serbia
-
 Singapore
-
 Slovakia
-
 Slovenia
-
 Somalia
-
 South Africa
-
 Spain
-
 Sri Lanka
-
 Sweden
-
 Switzerland
-
 Syria
-
 Taiwan
-
 Tajikistan
-
 Tanzania
-
 Thailand
-
 Trinidad and Tobago
-
 Tunisia
-
 Turkey
-
 UAE
-
 Uganda
-
 Ukraine
-
 United Kingdom
-
United States
-
 Uruguay
-
 Uzbekistan
-
 Venezuela
-
 Vietnam
-
 Yemen
-
 Zambia
-
 Zimbabwe
- Forex
- Crypto












