

SoFi stock extends downward price move as seller pressure dominates before earnings

SoFi (SOFI) stock is trading at $14.07, down 7.68% on the day. The price is currently positioned below its key moving averages.
 15.33
15.85
15.33
15.85
Highlights
- SoFi Technologies will report Q3 2026 earnings on October 27, raising short-term uncertainty for the stock.
- Anticipation of potential surprises in operational and financial disclosures is driving repositioning among market participants.
- Shares of SoFi trade below key moving averages with strong downtrend signals and are expected to consolidate between $13.73 and $14.41.
Investor caution grows as earnings date nears amid downtrend
SoFi Technologies is scheduled to report its Q3 2026 earnings on October 27, an event that is likely to drive investor focus toward upcoming operational and financial disclosures, according to Tipranks. As the earnings release approaches, anticipation of the company's results may lead to greater caution or repositioning by market participants. The proximity of the reporting date increases short-term uncertainty for the stock as investors prepare for potential surprises or downside risks amid the broader downtrend.
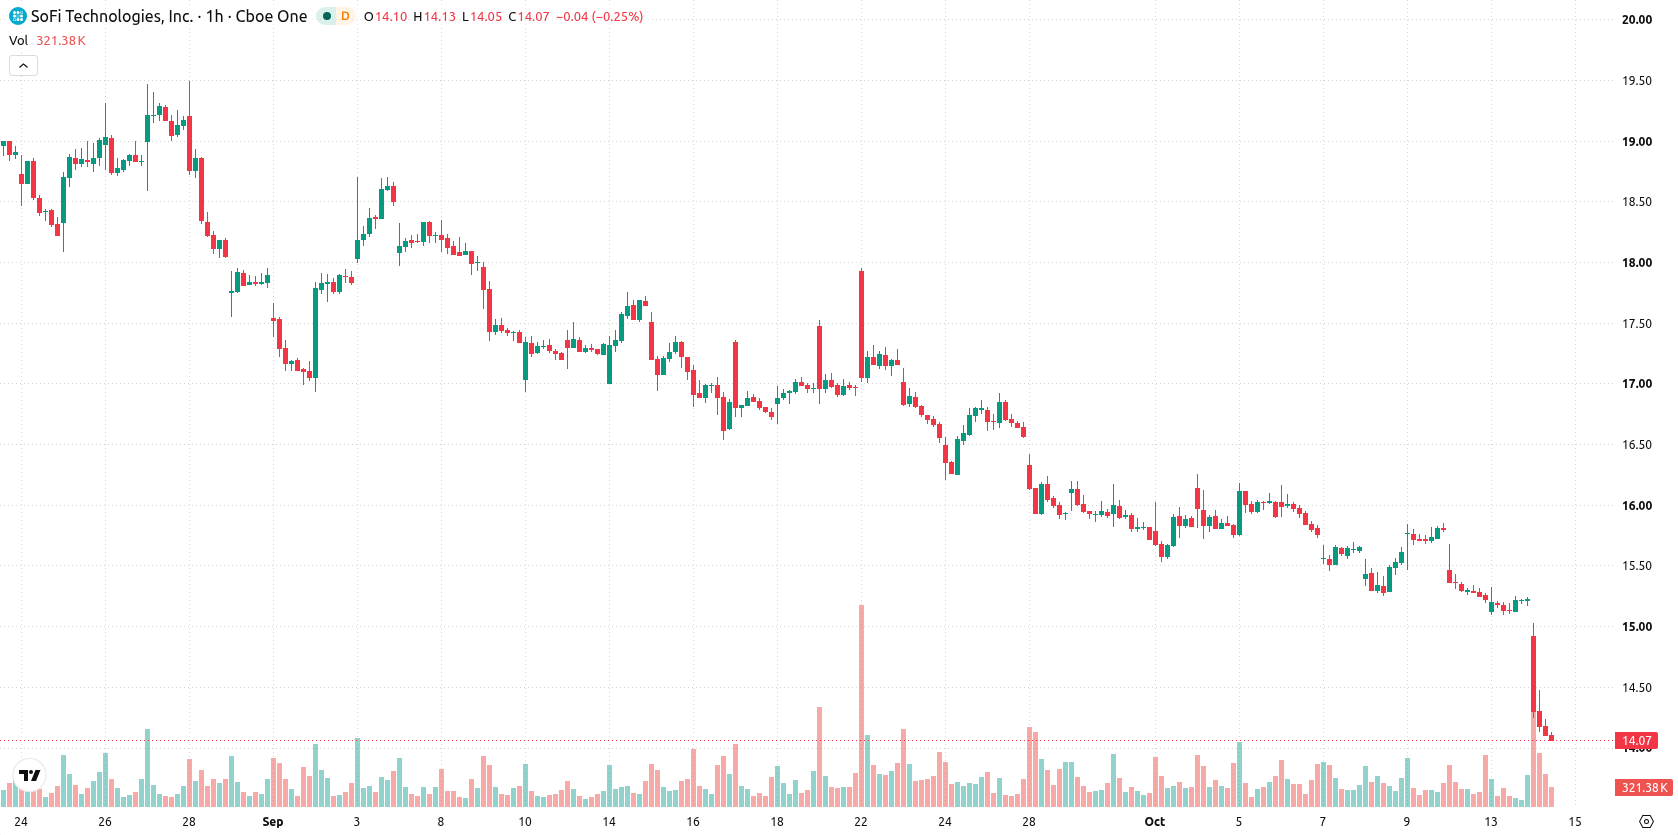
Bearish momentum persists as multiple technical signals align lower
SOFI is trading below specific key technical levels, including the MA-20 at $15.39 and MA-50 at $15.6 on the hourly chart, and below the MA-200 at $18.55 on the daily timeframe. The Ichimoku Kijun stands at $15.47, acting as immediate resistance. Momentum indicators provide a negative backdrop: MACD shows a strong sell signal, while ADX also confirms a sell. RSI reads 37.79, CCI is in sell territory, and Bull/Bear Power signals seller dominance. The Stochastic RSI is overbought, suggesting short-term exhaustion, while the Awesome Oscillator remains neutral, offering no clear countertrend momentum. Intraday action featured a small negative gap, a close near session lows, and moderate volatility, confirming ongoing downward momentum.
Downside risk elevated as consolidation range narrows
In the coming days, SOFI is expected to consolidate within the $13.73 to $14.41 range, reflecting the prevailing volatility band relative to current levels. The probability of an upward move is very low, while the risk of a sustained downward extension below $13.73 remains elevated. Any sustained rebound would first require reclaiming resistance at $15.47.
Earlier, analysts noted selective optimism toward SoFi, highlighting its operating momentum as a key factor behind favorable ratings. As short-term technical weakness coincides with heightened anticipation for SoFi’s upcoming earnings, traders should monitor for a decisive move below $13.73, as this could signal a continuation of the current downtrend.





Latest SoFi News






-
 Afghanistan
-
 Albania
-
 Algeria
-
 Angola
-
 Argentina
-
 Armenia
-
 Australia
-
 Austria
-
 Azerbaijan
-
 Bahamas
-
 Bahrain
-
 Bangladesh
-
 Belarus
-
 Belgium
-
 Bolivia
-
 Botswana
-
 Brazil
-
 Brunei
-
 Bulgaria
-
 Cambodia
-
 Cameroon
-
 Canada
-
 Chile
Chile
-
 China
China
-
 Colombia
-
 Congo
Congo
-
 Costa Rica
-
 Cote d'Ivoire
-
 Croatia
-
 Cuba
Cuba
-
 Cyprus
-
 Czechia
-
 DR Congo
-
 Denmark
-
 Dominican Republic
-
 Ecuador
-
 Egypt
Egypt
-
 El Salvador
-
 Estonia
-
 Eswatini
-
 Ethiopia
-
 Finland
-
 France
-
 Georgia
-
 Germany
-
 Ghana
Ghana
-
 Greece
-
 Haiti
Haiti
-
 Hong Kong
-
 Hungary
-
 India
India
-
 Indonesia
-
 Iran, Islamic republic
-
 Iraq
Iraq
-
 Ireland
-
 Israel
-
 Italy
Italy
-
 Jamaica
-
 Japan
Japan
-
 Jordan
-
 Kazakhstan
-
 Kenya
Kenya
-
 Korea
Korea
-
 Kuwait
-
 Kyrgyzstan
-
 Laos
Laos
-
 Latvia
-
 Lebanon
-
 Lesotho
-
 Libya
Libya
-
 Lithuania
-
 Luxembourg
-
 Madagascar
-
 Malaysia
-
 Malta
Malta
-
 Mauritius
-
 Mexico
-
 Moldova
-
 Mongolia
-
 Montenegro
-
 Morocco
-
 Mozambique
-
 Myanmar
-
 Namibia
-
 Nepal
Nepal
-
 Netherlands
-
 New Zealand
-
 Nigeria
-
 North Macedonia
-
 Norway
-
 Oman
Oman
-
 Pakistan
-
 Palestine
-
 Panama
-
 Papua New Guinea
-
 Paraguay
-
 Peru
Peru
-
 Philippines
-
 Poland
-
 Portugal
-
 Puerto Rico
-
 Qatar
Qatar
-
 Reunion
-
 Romania
-
 Rwanda
-
 Saudi Arabia
-
 Serbia
-
 Singapore
-
 Slovakia
-
 Slovenia
-
 Somalia
-
 South Africa
-
 Spain
Spain
-
 Sri Lanka
-
 Sweden
-
 Switzerland
-
 Syria
Syria
-
 Taiwan
-
 Tajikistan
-
 Tanzania
-
 Thailand
-
 Trinidad and Tobago
-
 Tunisia
-
 Turkey
-
 UAE
UAE
-
 Uganda
-
 Ukraine
-
 United Kingdom
-
United States
-
 Uruguay
-
 Uzbekistan
-
 Venezuela
-
 Vietnam
-
 Yemen
Yemen
-
 Zambia
-
 Zimbabwe
- Forex
- Crypto












