

INTC falls as seller pressure persists following manufacturing site incident

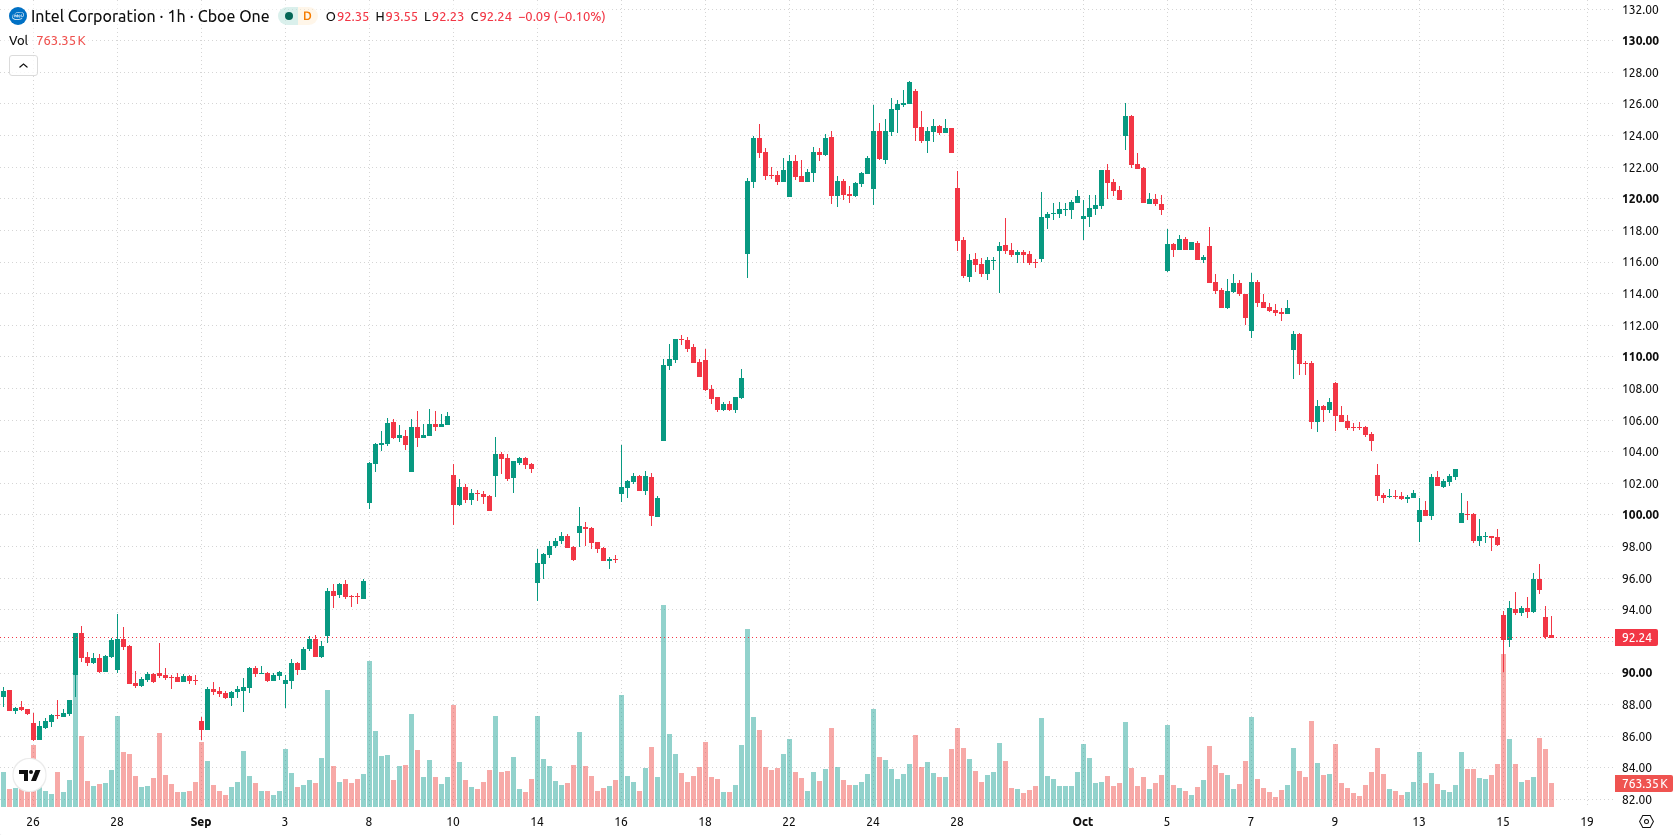
Intel (INTC) stock is trading at $93.21, down 2.26% for the session. The stock currently sits below its key moving averages, indicating a bearish short-term setup.
 93.82
102.88
93.82
102.88
Highlights
- An explosion and fire at Intel's Kiryat Gat facility raised operational concerns about near-term supply chain stability.
- Birchbrook Inc. cut its stake in Intel by 82.6% in the third quarter, while institutional holdings shifted both higher and lower.
- Intel stock trades below key short- and medium-term moving averages with bearish momentum, and forecasts suggest a very high probability of further downside toward $87.46 to $98.96 over the next 2 to 3 days.
Supply chain uncertainty as factory fire and stake reduction drive sentiment
Intel faced heightened production concerns after an explosion and fire at its Kiryat Gat manufacturing site in Israel, a significant operational incident that raised questions about supply chain stability, according to Quiverquant and TradingKey. This development has cast uncertainty over near-term output, weighing on investor sentiment as the market focuses on potential production disruptions. In addition, Birchbrook Inc. reduced its stake in Intel Corporation by 82.6% in the third quarter, while Quiverquant data indicated shifting institutional positions, with both increases and reductions in holdings.
Downside momentum persists as technical resistance and weak signals cluster
On the hourly chart, INTC is trading below the MA-20 at $97.73 and the MA-50 at $102.54, confirming that short- and medium-term averages have been crossed to the downside. The price remains above the MA-200 on the daily timeframe at $84.27, highlighting it as key long-term support, while the Ichimoku Kijun at $96.45 acts as immediate resistance. Momentum readings are weak: MACD signals Strong Sell, ADX confirms the presence of a selling trend, and Bull/Bear Power indicates intraday dominance of sellers. RSI is at 38.74 (Sell zone), Stoch RSI is in the overbought area, while CCI and Awesome Oscillator both produce neutral signals. Notably, a gap lower from the previous close accompanied high volatility intraday, with Stoch RSI showing some divergence against the prevailing bearish pressure.
Neutral-to-bearish bias as volatility narrows range and supports risk
Looking ahead, the expected price range over the next 2–3 trading days is $87.46 to $98.96, reflecting the anticipated volatility band relative to current levels. The baseline scenario is for sideways action within this corridor, with further downside seen as more probable than a reversal, based on indicator and trend analysis. A bullish case would require a break above resistance near the Kijun level and movement toward the upper end of the range. Conversely, a bearish scenario could develop if price loses support near the lower boundary, potentially setting off an accelerated decline.
Earlier, analysts noted that Intel was attempting to stabilize following a series of company-specific risks and operational uncertainties. The latest technical signals and trading behavior suggest that traders should monitor the $87.46–$98.96 range for further downside volatility, with attention to any breach of key long-term supports.





Latest Intel News






-
 Afghanistan
-
 Albania
-
 Algeria
-
 Angola
-
 Argentina
-
 Armenia
-
 Australia
-
 Austria
-
 Azerbaijan
-
 Bahamas
-
 Bahrain
-
 Bangladesh
-
 Belarus
-
 Belgium
-
 Bolivia
-
 Botswana
-
 Brazil
-
 Brunei
-
 Bulgaria
-
 Cambodia
-
 Cameroon
-
 Canada
-
 Chile
Chile
-
 China
China
-
 Colombia
-
 Congo
Congo
-
 Costa Rica
-
 Cote d'Ivoire
-
 Croatia
-
 Cuba
Cuba
-
 Cyprus
-
 Czechia
-
 DR Congo
-
 Denmark
-
 Dominican Republic
-
 Ecuador
-
 Egypt
Egypt
-
 El Salvador
-
 Estonia
-
 Eswatini
-
 Ethiopia
-
 Finland
-
 France
-
 Georgia
-
 Germany
-
 Ghana
Ghana
-
 Greece
-
 Haiti
Haiti
-
 Hong Kong
-
 Hungary
-
 India
India
-
 Indonesia
-
 Iran, Islamic republic
-
 Iraq
Iraq
-
 Ireland
-
 Israel
-
 Italy
Italy
-
 Jamaica
-
 Japan
Japan
-
 Jordan
-
 Kazakhstan
-
 Kenya
Kenya
-
 Korea
Korea
-
 Kuwait
-
 Kyrgyzstan
-
 Laos
Laos
-
 Latvia
-
 Lebanon
-
 Lesotho
-
 Libya
Libya
-
 Lithuania
-
 Luxembourg
-
 Madagascar
-
 Malaysia
-
 Malta
Malta
-
 Mauritius
-
 Mexico
-
 Moldova
-
 Mongolia
-
 Montenegro
-
 Morocco
-
 Mozambique
-
 Myanmar
-
 Namibia
-
 Nepal
Nepal
-
 Netherlands
-
 New Zealand
-
 Nigeria
-
 North Macedonia
-
 Norway
-
 Oman
Oman
-
 Pakistan
-
 Palestine
-
 Panama
-
 Papua New Guinea
-
 Paraguay
-
 Peru
Peru
-
 Philippines
-
 Poland
-
 Portugal
-
 Puerto Rico
-
 Qatar
Qatar
-
 Reunion
-
 Romania
-
 Rwanda
-
 Saudi Arabia
-
 Serbia
-
 Singapore
-
 Slovakia
-
 Slovenia
-
 Somalia
-
 South Africa
-
 Spain
Spain
-
 Sri Lanka
-
 Sweden
-
 Switzerland
-
 Syria
Syria
-
 Taiwan
-
 Tajikistan
-
 Tanzania
-
 Thailand
-
 Trinidad and Tobago
-
 Tunisia
-
 Turkey
-
 UAE
UAE
-
 Uganda
-
 Ukraine
-
 United Kingdom
-
United States
-
 Uruguay
-
 Uzbekistan
-
 Venezuela
-
 Vietnam
-
 Yemen
Yemen
-
 Zambia
-
 Zimbabwe
- Forex
- Crypto












